DOT, LTC and LINK could all correct lower before bulls resume their uptrend
Litecoin and ChainLink, like most other cryptocurrencies, have followed Bitcoin (BTC) into the red as markets react to potentially bearish comments by US Treasury Secretary nominee Janet Yellen.
The former Federal Reserve chair claimed during a Senate Finance committee hearing that cryptocurrencies were largely used in financing illicit activities.
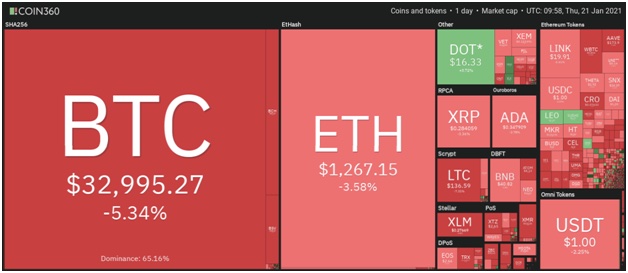
The market reaction has seen BTC price dip towards lows of $32,000 on Thursday morning. In the broader crypto market, only DOT is in the green among the top ten on CoinMarketCap.
But with further downward pressure likely before markets resume their bullish momentum, DOT and other top coins are likely to witness corrective pullbacks.

Crypto price map. Source: Coin360
DOT/USD
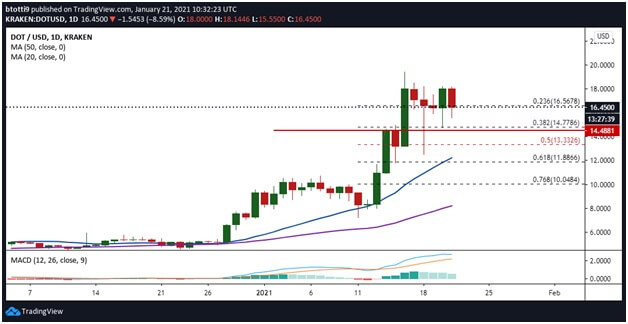
Polkadot faces a downward correction that could see it retreat further from its recently hit all-time high of $19.32.
The DOT/USD pair has broken below the 23.6% Fibonacci retracement level ($16.56) and tested support at the 38.2% Fibonacci retracement level at $14.77. The level acted as a strong rebound zone, with prices back above the $16.00 threshold.
If bulls push higher, Polkadot price could retest resistance at intraday highs around $18.14. The main target short term is to take out the supply wall near the $19.32 high, with potential rallies to $22.00 and then $24.00.

DOT/USD daily chart. Source: TradingView
On the flipside, sinking prices below major support at $14.77 could see bulls seek to defend gains around the 50-SMA ($12.22). The weakening MACD suggests further declines towards the psychological $10.00 and 20-SMA ($8.20).
LTC/USD
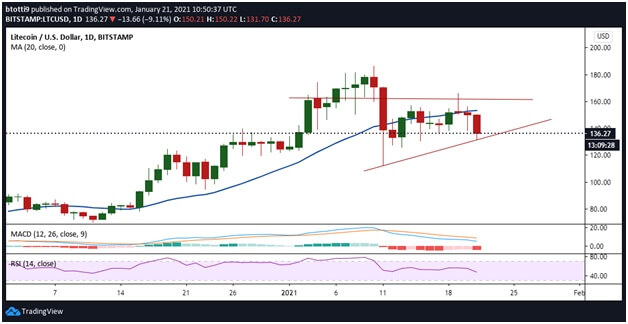
A recent break below the 20-SMA ($153) line has encouraged bears, and short term loss seems to be the most likely outcome for Litecoin.
Litecoin (LTC) has dropped to around $135 at the time of writing. If bears sustain the onslaught, the 50-SMA level ($122) could provide refuge for the bulls. Bulls will need to prevent any more losses beyond $120, confirmation of which puts bears firmly in charge and opens up a path for a retest of $100 level.

LTC/USD daily chart. Source: TradingView
The negative divergence of the RSI below the 50-point and the MACD’s bearish outlook suggests shorts could have their day.
If LTC/USD corrects upwards and hits above the 20-SMA, a run to $160 could see bulls aim for recent highs around $186.
LINK/USD
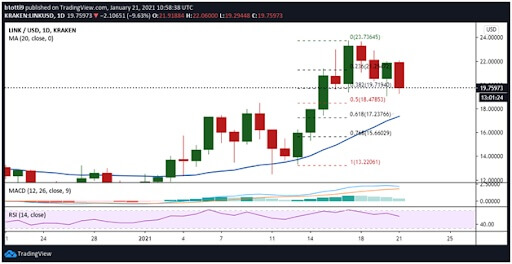
ChainLink is currently looking to stem the downside correction at the 38.2% Fibonacci retracement level ($19.71). This comes after increased profit booking pushed LINK/USD below the major support line at $20.00.
If bears maintain their aggression, ChainLink’s price could likely drop to the 20-SMA support ($17.37). Here bulls could also look to the 61.8% Fibonacci retracement level of the upside from $13.23 low to $23.73 high for support ($17.23).

LINK/USD daily chart. Source: TradingView
The upward-pointing curve of the 20-SMA, RSI above the midpoint, and MACD in the bullish zone suggest bulls are still in action.
As such, reclaiming support above $20.00 could help bulls target $23.00, with further gains likely to take LINK/USD to highs of $30.

