

XRP price has retraced below $1.50 but remains well supported above the 100 SMA on the 4-hour chart
XRP is trading around 7.5% down on the day after intraday trading has seen its price drop off from $1.55. The cryptocurrency’s value currently swings near $1.49 as bulls seek to rebound off lows of $1.40.
The struggles in the Ripple market are the complete opposite of Ethereum’s parabolic swing over the past 24 hours. The second-largest cryptocurrency by market cap is up nearly 8% on the day and over 30% this past week as bulls seek to consolidate above $3,300.
As for XRP, buyers need to flip $1.50 into support before attempting another push for a new all-time high.
The popular but pseudonymous XRP analyst cryptoWZRD says the technical outlook for XRP/USD and XRP/BTC suggests fresh gains to a new ATH are likely. According to the analyst, a bullish breakout for the BTC pair will help catapult XRP price above $1.95.
XRP Daily Technical Outlook:$XRP and XRPBTC both closed with doji candles after testing their support targets. XRPBTC will soon get a bullish breakout and that will push XRP above $1.9500. I will be looking for scalps in XRP tomorrow 🧙♂️ pic.twitter.com/v3TcTRlCXZ
— CRYPTOWZRD (@cryptoWZRD_) May 4, 2021
Ripple price outlook
XRP/USD remains in a positive zone as shown on the 4-hour chart, despite flipping below the support line of a recently formed rising channel. This outlook follows the breakout from lows of $0.94 on 25 April that saw prices trade above a bearish trend line to reach highs of $1.66.
As long as the price stays above the 0.5 Fibonacci retracement level of the swing from $1.96 to $0.91 at $1.44, XRP is likely to rebound higher. In this case, bulls are likely to target recent resistance levels at $1.56 (0.618 Fib level) and $1.74 (0.786 Fib level).
This perspective will also remain in play if the price drops below the $1.40 anchor but rebounds off the 100 SMA price level near $1.35.
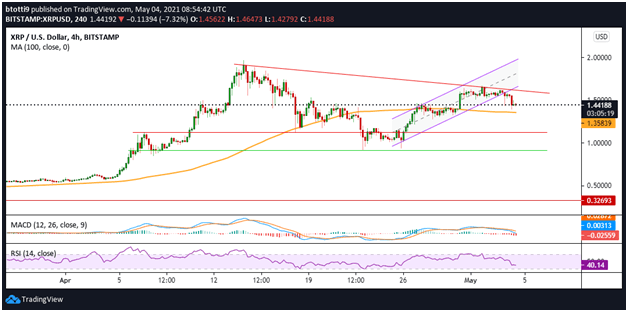
XRP/USD 4-hour chart. Source: TradingView
On the downside, the MACD is within the bearish zone and the RSI is trending with a negative divergence below 50 to suggest sellers have the upper hand.
The downtrend from the above channel could intensify if bulls fail to hold above the 100 SMA. In this case, bears might look to breach $1.30 and target the support zone near $1.12 (red horizontal line). The psychological $1.00 provides the main demand zone, from where a fresh rally could materialise.