XRP price has increased nearly 50% over the past week
Ripple’s XRP continues to seek new gains after another spike this week. Buying pressure has seen XRP/USD value surge by 12% over the past 24 hours, cumulatively taking the cryptocurrency’s price nearly 50% north since 25 April when bulls rebounded above $1.00.
XRP price is hovering near $1.54 as of writing, with a bullish technical outlook suggesting further gains are possible. Unless a big crash is on the horizon, the 4th ranked cryptocurrency is set for its highest monthly close since December 2017.
Data from on-chain analytics platform, Santiment, suggests increased buying pressure for XRP as whale activity spikes. As shared by crypto analyst Ali Martinez, this had added to the overall bullish picture for Ripple bulls.
$XRP whales have gone into a buying spree. @santimentfeed reveals that 19 new addresses with more than 1,000,000 #XRP have joined the network since April 23.
Further upward pressure could push this cryptocurrency to new yearly highs. pic.twitter.com/VOM7Ep2Pc4
— Ali (@ali_charts) April 28, 2021
Ripple price analysis

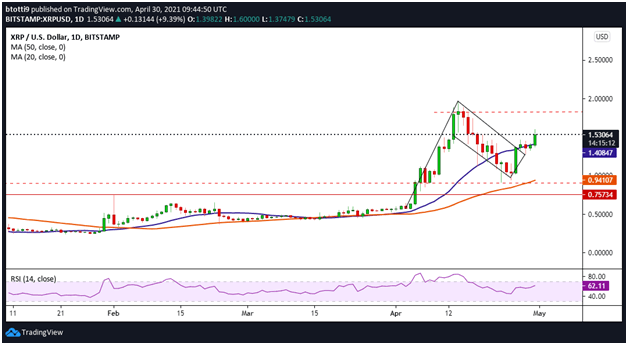
XRP/USD daily chart. Source: TradingView
The price is trading higher after breaking above a bearish trendline that capped upward movement during the recent correction from $1.96, down to lows of $0.94.
The daily chart also highlights a bullish flag pattern breakout for XRP. The XRP/USD pair is currently increasing above $1.50 with robust support at the 20 SMA ($1.40).
If bulls maintain the upward pressure, the price might breach the next supply zone at $1.65. A bullish continuation, as suggested by the pattern, might take prices above the next barrier at $1.84. In the short term, this increase might see buyers aim for fresh highs above $2.00, with $2.20 the next in line.
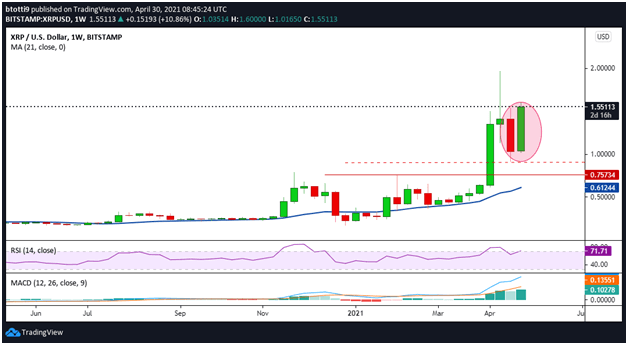
The positive outlook for XRP is also visible on the weekly chart. The bullish engulfing candlestick pattern and the overall picture of the weekly RSI and weekly MACD suggest bulls are in charge.

XRP/USD weekly chart. Source: TradingView
However, if the market turns bearish and bulls lose their upside momentum, XRP might decline to initial support at $1.50. The 20-day moving average (currently reading $1.40) offers the next major support zone.
A flip below the above level will spell downward danger for XRP/USD. In this case, the first major support zone below $1.00 is at the 50 SMA near $0.94. If that happens and bulls fail to rebound off this level, another sell-off will allow bears to target the critical horizontal support line at $0.75.

