After recovering from an earlier slump, the cryptocurrency market is heading into the red territory again as bears start to regain control
The cryptocurrency market is trading in the red zone again after bouncing back from the early slump this week. Solana, Litecoin and Ethereum Classic are looking bearish at the moment. The three cryptocurrencies could suffer further losses over the coming days if the sentiment continues.
Solana price outlook
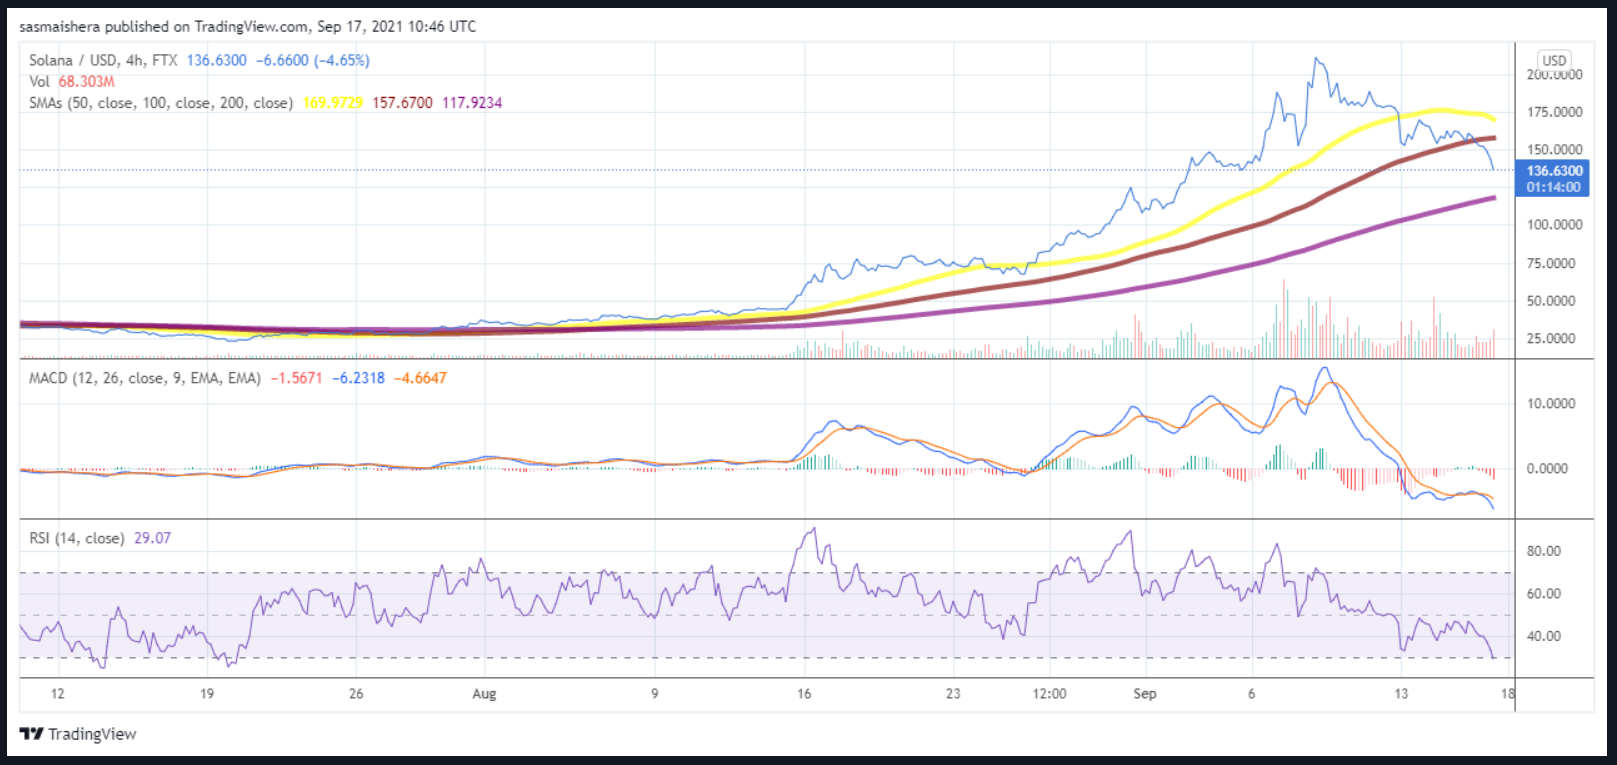
The SOL/USD 4-hour chart is currently bearish, with the coin down by 12% in the past 24 hours. The Solana network experiencing a blackout for nearly 24 hours contributed to the coin’s underperformance, and it has now lost the sixth position in the market cap rankings to XRP.

SOL/USD 4-hour chart. Source: TradingView
SOL is trading at $140 per coin and could drop towards the $128 support level over the coming hours if the current bearish sentiment continues. The second major support level at $108 should limit the downward movement unless the cryptocurrency market experiences further sell-off.
On the flipside, SOL could test the resistance point at $167 if the bulls regain control of the market. Solana could surge further towards the $180 mark if there is an extended bull run.
Litecoin price outlook
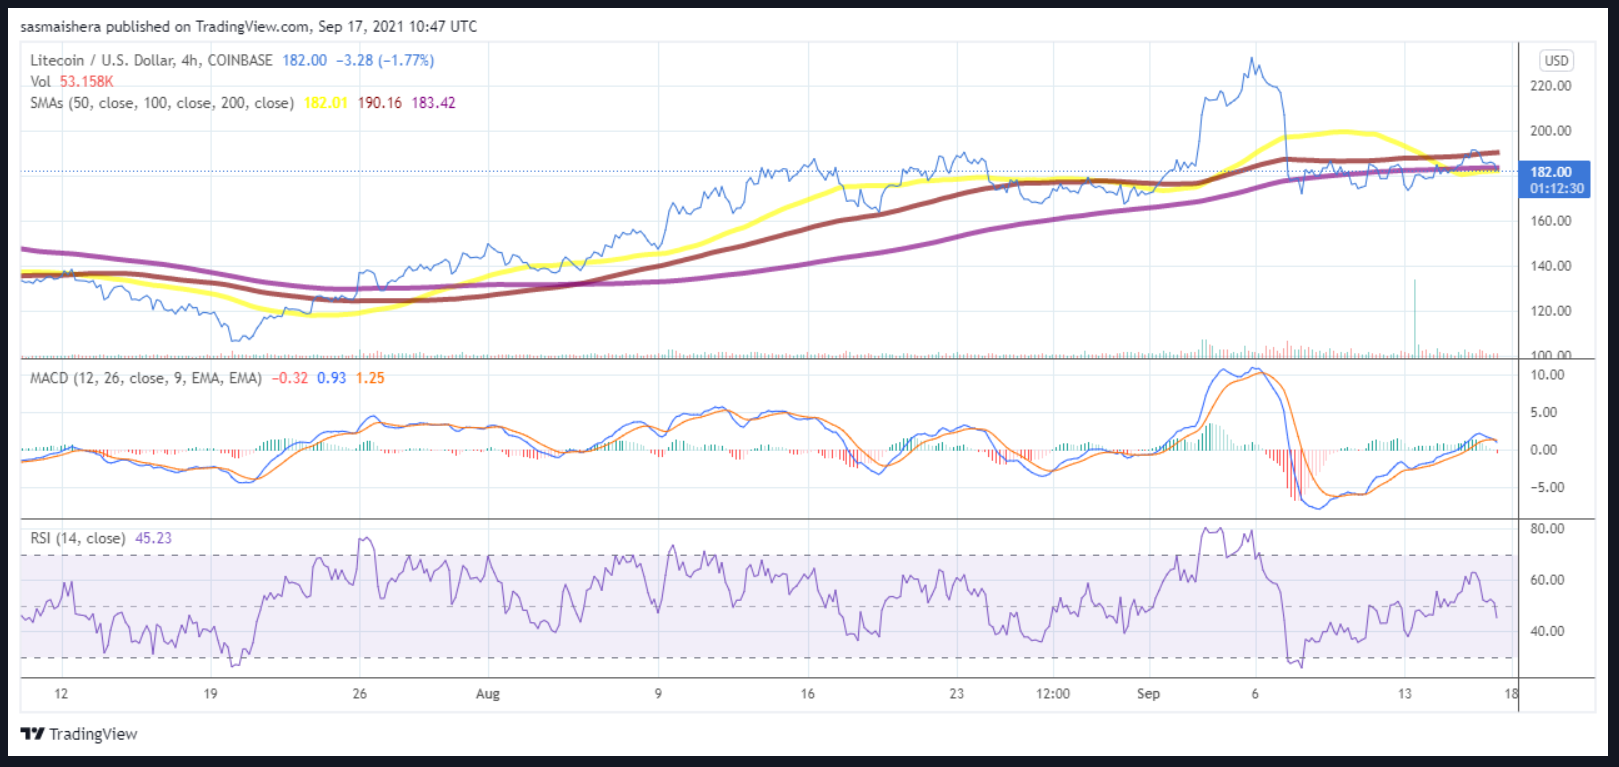
The LTC/USD 4-hour chart is also bearish after the cryptocurrency lost more than 2% of its value in the past 24 hours. It risks dropping below the first major support level at $172 over the coming hours if the market sell-off continues.

LTC/USD 4-hour chart. Source: TradingView
In the event of an extended bearish run, the second major support level at $166 could be tested. However, LTC should be able to steer clear of the sub-$150 levels over the coming hours and days.
Check out our how to buy Litecoin page here
Ethereum Classic price outlook
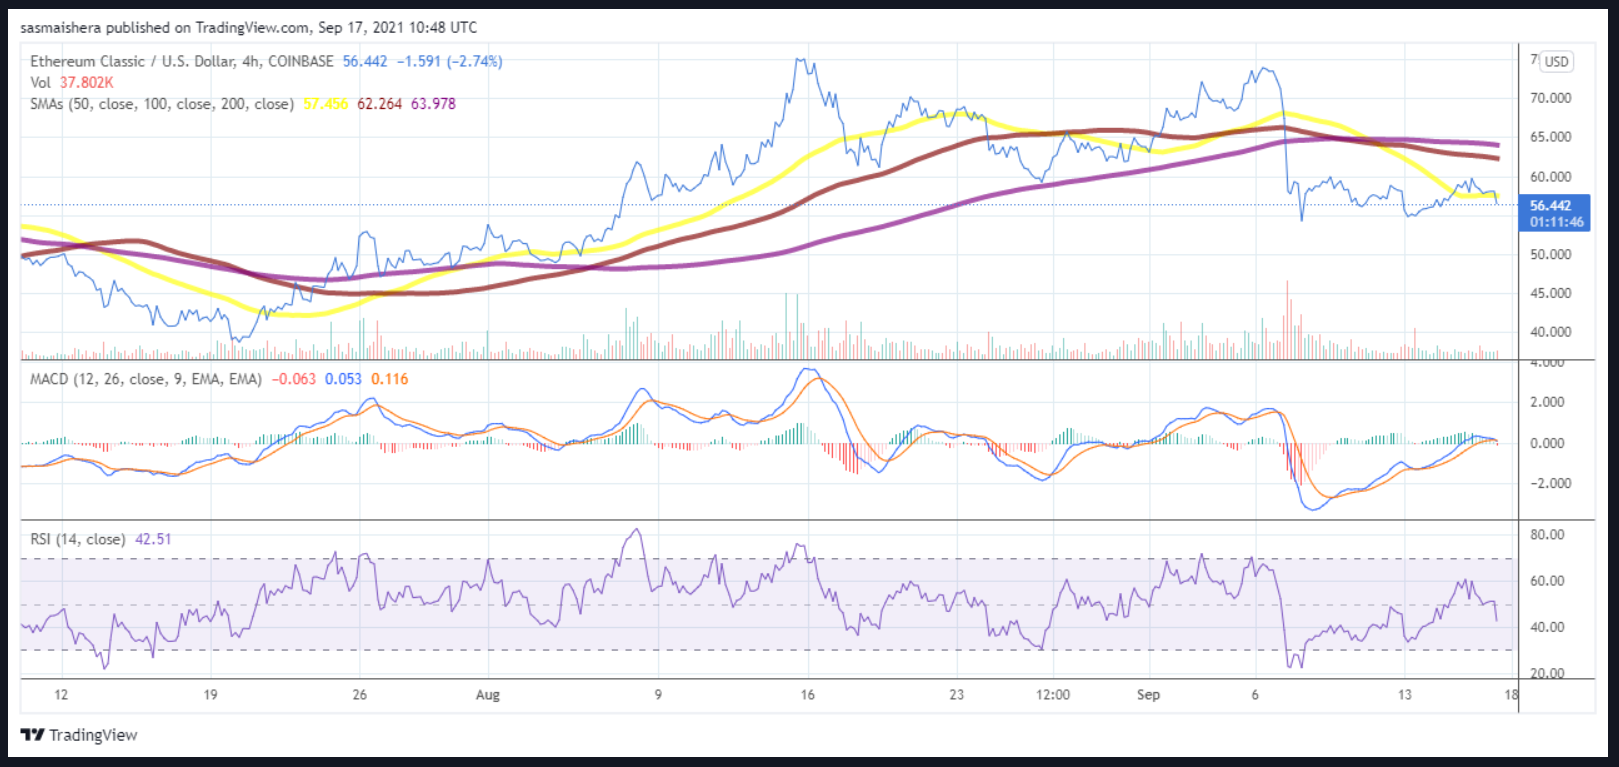
Ethereum Classic, like the others, is also bearish at the moment. The ETC/USD 4-hour chart is in the bearish zone, and the cryptocurrency is trading at around $56 — below its 100 simple moving average (SMA). If the losses continue, ETC could drop below the first major support level at $49 per coin. However, it should defend the support level at $39 unless there is an extended period of sell-off in the broader market.

ETC/USD 4-hour chart. Source: TradingView
On the flip side, if the market recovers, ETC could break past the first resistance point at $64. Last week’s high of $76 should limit further upward movement in the short term, unless the market rally continues.

