Stellar Lumens skyrocketed as several technical indicators turned bullish, gaining 33% in just one hour
Stellar Lumens maintained its position in the crypto market cap top 10 list with a massive surge in XLM’s price in the past 24 hours. The descending triangle that it has been forming since 7 Jan has finally been broken, and XLM pushed to the upside.
XLM’s overall outlook is bullish mostly due to its technicals rather than fundamentals. XLM managed to score week-over-week gains of 19.10%. When compared to other cryptocurrencies, it outperformed both Bitcoin (BTC) and Ethereum (ETH), that posted gains of 1.56% and 11.32%, respectively.
At the time of writing, XLM is trading at $0.322, representing a price increase of only 7.12% over the previous month.
XLM/USD
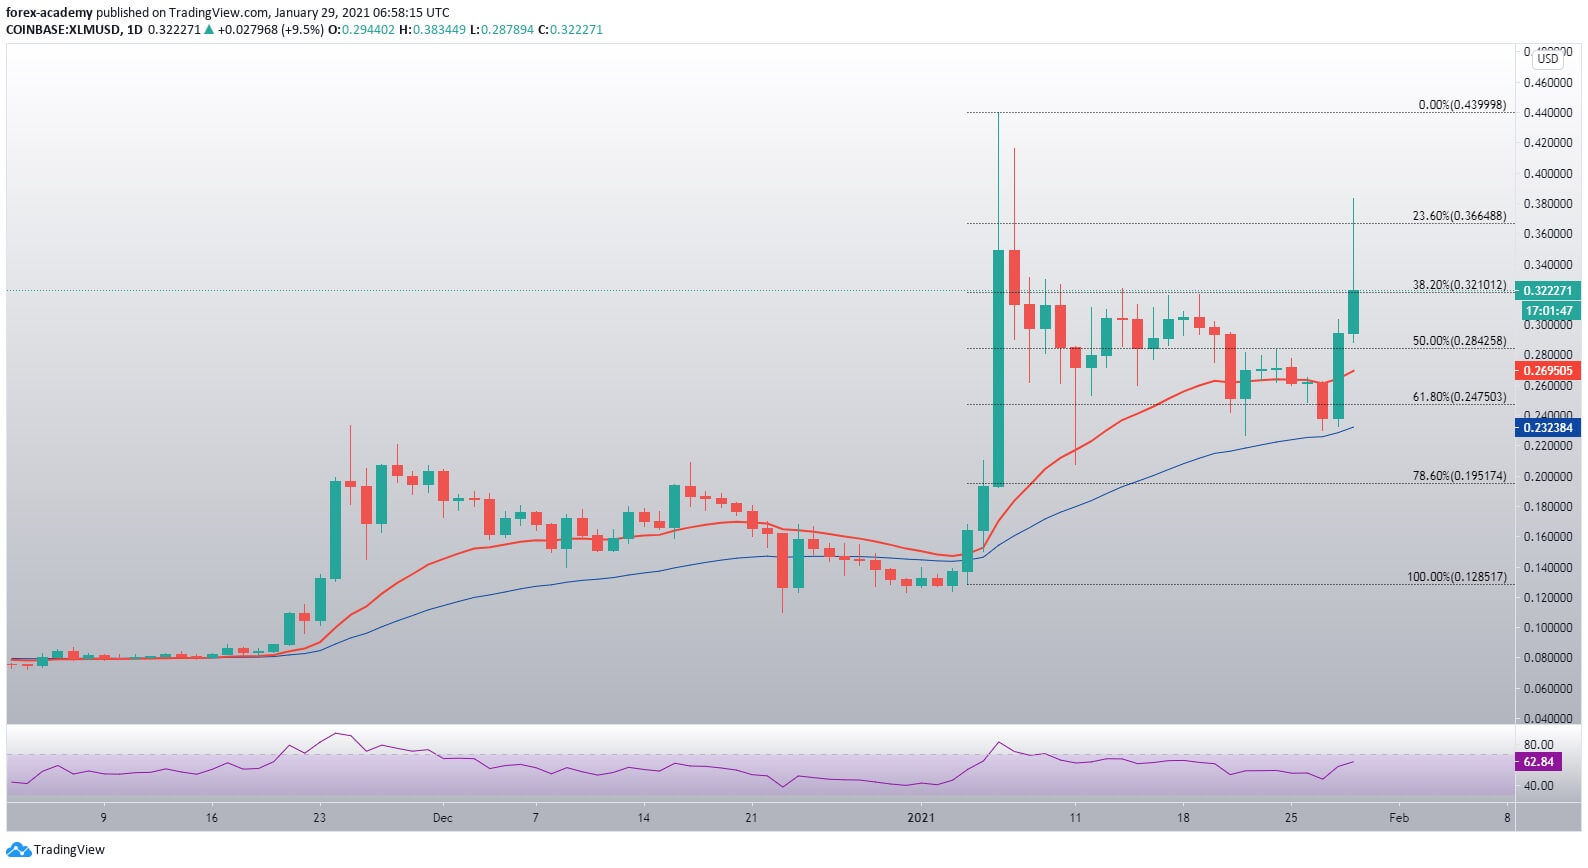
Stellar Lumens broke out of the descending triangle it started forming on 7 Jan. XLM was making a series of lower highs within the triangle, with the $0.23 support level holding its price above it. A recent spike in buying pressure caused Stellar to push its price and break the triangle at the ~80% completion mark. On top of that several other technical indicators pointed towards the buy-side, such as the Parabolic SAR, Supertrend and MACD indicators.
XLM is currently fighting for the 38.2% Fib retracement level of $0.321, which will decide its short-term future. However, with all of the major indicators pointing towards the buy-side, XLM is in a good spot now.
However, if its Supertrend or Parabolic SAR indicators turn bearish, XLM might push towards $0.23 or even the $0.123 level.

XLM’s daily timeframe RSI is quickly moving towards the overbought territory, and is currently sitting at a value of 62.84.

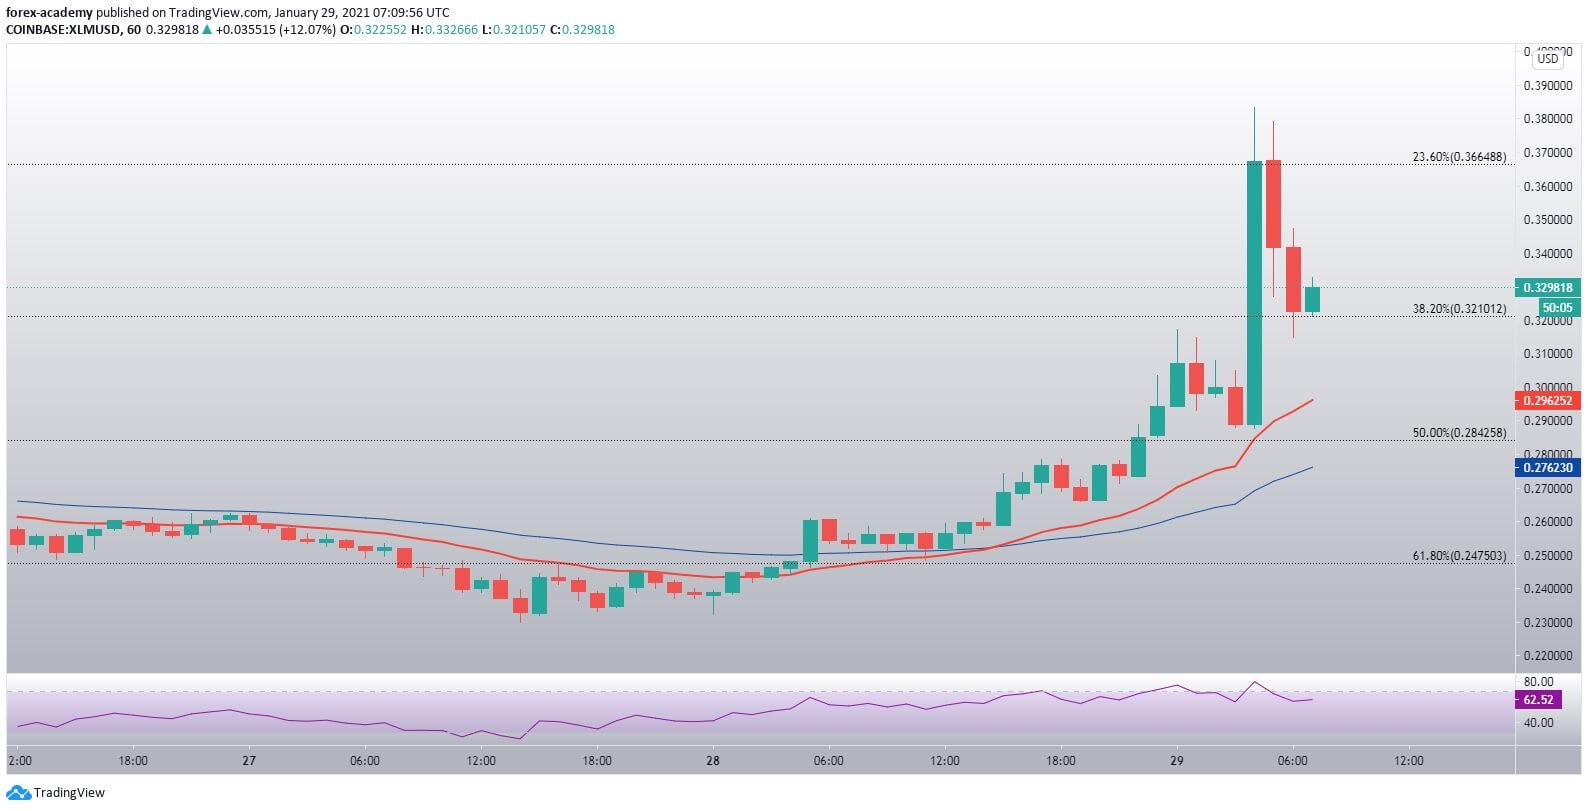
XLM’s hourly time-frame shows us clearly how the cryptocurrency managed to gain as much as 33% in just one hour. However, such a parabolic move requires a strong pullback in order to be considered healthy. In this case, XLM pulled back to its 38.2% Fib retracement level of $0.321.

