XLM/USD price is trending lower as buyers fail to hold gains racked up in four straight sessions of upward momentum
XLM/USD is slightly bearish on the hourly charts as bulls fight to retain the upper hand on the daily timeframes. As of press time, the pair has shed over 2.5% of its value as slowed momentum means buyers are unlikely to send prices higher for a fifth straight session.
On Monday, Grayscale Investment noted that the Stellar network and its native token XLM could potentially see widespread adoption. According to the investment platform, Lumens could become a preferred currency for cross-border payments.
On Wednesday, the token surge to a high of $0.0705, helping XLM/USD cross above a downward trendline.
Nonetheless, a downturn seen over the past 24 hours has dented optimism. Stellar’s struggles are mirroring those of market leaders, Bitcoin and Ethereum, both of which traded lower during the Asian trading session on Friday.
XLM/USD daily price
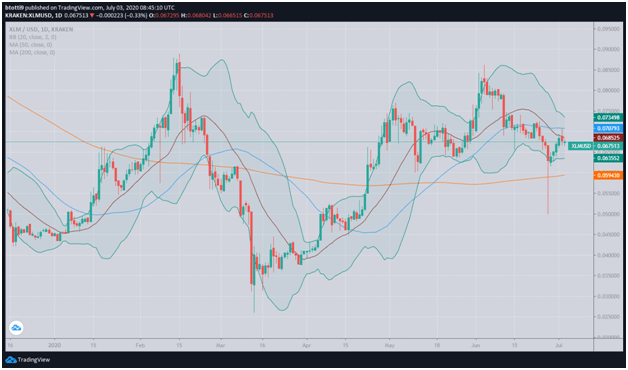
On the daily chart, XLM/USD is trading just above the downtrend line, so buyers must hold prices above $0.0629 to avoid a dip to the 200 MA at $0.0592
A drop to this level will see the technical charts confirm XLM/USD as firmly in a bearish zone. As of writing, the token’s market displays no traction as shown by the Bollinger Bands on the daily charts.

On the upside, bulls will need to breach resistance at the 20-day SMA at $0.068 and the 50-day MA at $0.070. Incidentally, the latter provided the main support level as the price of Stellar Lumens (XLM) surged to near $0.09 earlier in June.

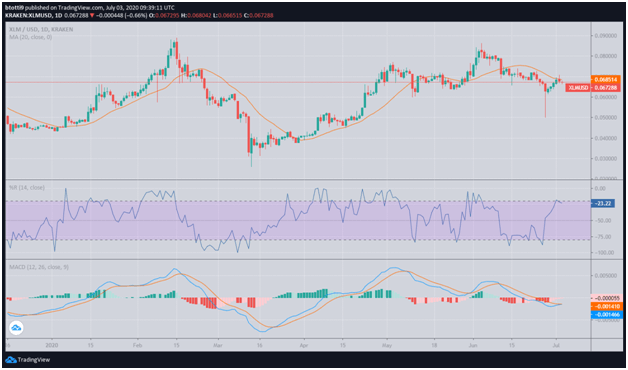
The MACD suggests a bearish divergence, with the signal crossing under to indicate a likely reversal is diminishing.
The RSI is currently sloping. In the last trading session, the indicator had turned north, away from the negative region, as buyers reclaimed the upper hand and pushed prices higher.

