Bitcoin (BTC) price has hit a new all-time high above $22,500 but could still rise to $120k if its 2021 trajectory targets the log growth curve
Bitcoin’s price broke clear of the $20,000 barrier en route to a new all-time high (ATH) above $22,500. The benchmark cryptocurrency appears to be on the launch pad ready for another bull run. Already, the early Asian trading session has seen gains in the last few hours taking BTC/USD to highs of $22,600 on some major cryptocurrency exchanges.
The BTC market cap is currently over $415 billion, with BTC/USD adding more than 15% to its value in the past 24 hours.
Meanwhile, Guggenheim Investments CIO Scott Minerd said in an interview that the fair value of Bitcoin against the US dollar should be at least $400,000.
But while this is not entirely impossible for BTC, the technical outlook suggests a modest target range of $120—$140k for 2021.
BTC to track key growth curve
Decentrader co-founder and technical analyst Filbfilb has said that the breakout to the new ATH above $22k is likely just the start for Bitcoin as the asset hits price discovery mode.
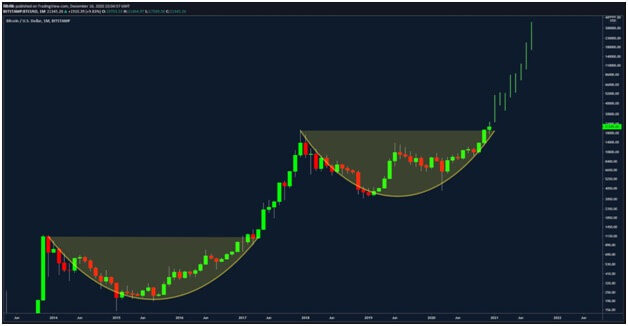
“A move at the same pace to the previous ATH breakout puts Bitcoin at an astronomical 300k before the end of next year. Looks nice, seems hugely unlikely, but virtually no one saw 20k coming for 2017 at this equivocal stage. The big money entering are referring to this figure.”
 Chart suggesting BTC price could surge to $300k. Source: Filbfilb on Twitter.
The above outlook mirrors the Guggenheim CIO assertion about Bitcoin’s price. However, while BTC at $300 or $400k by the end of 2021 seems unlikely, Filbfilb suggests a more reasonable outlook would be the $120—140k range.
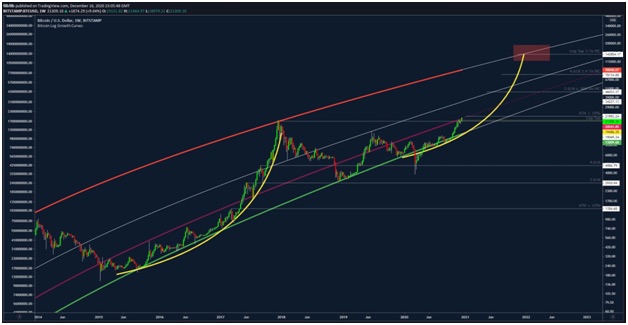
According to the analyst, Bitcoin needs to track the logarithmic trend channel to achieve these astronomical price levels.
 Bitcoin’s log trend chart. Source: Filbfilb
As per the chart shown above, the 2.618 Fibonacci retracement level of the previous bull cycle marks the median line of the logarithmic growth curve. The barrier puts BTC/USD at $46k by December 2021.
The next critical Fib level is 4.618, where the price line is at around $78k. If Bitcoin trends to the top curve, the EOY 2021 could see BTC trading near or above $120,000.
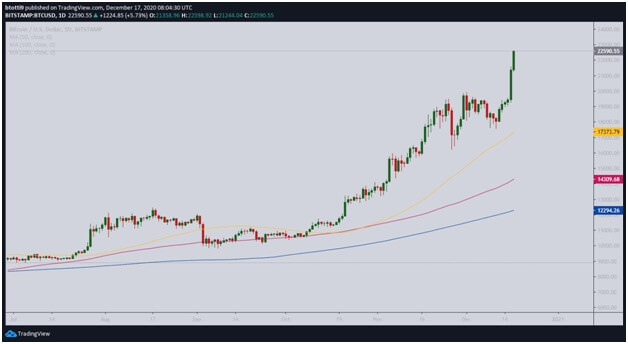
 BTC/USD daily chart. Source: TradingView
At the time of writing, BTC/USD is trading around $22,590, charting extremely bullish scenarios on both lower and higher time frames.
The daily chart has all three major moving averages below the current price level: the 50-SMA ($17,367), 100-SMA ($14,306), and 200-SMA ($12,292). The short term target is $24,000 but should a pullback materialise, the above SMA levels provide robust support levels.

