Stellar is trading at $0.083, a price level above which a breakout to $0.086 will see bulls aim at $0.12
Downward pressure across the crypto markets means most coins are trading at a discount compared to their opening price in the past 24 hours.
Stellar (XLM) is among several top altcoins that have dipped since Bitcoin recoiled from highs of $18,500. XLM has seen its market value against the US dollar drop by 2.79% in the past 24 hours to trade around $0.0827 at the time of writing.
But despite the downward pressure, the technical outlook for XLM/USD remains largely within the realm of the bulls. If prices hold above $0.080, the next few days could see a fresh rally to $0.12 (2020 high reached in August).
However, a loss of the upside momentum could see XLM/USD tank to 24 September lows around $0.064.
XLM/USD price analysis
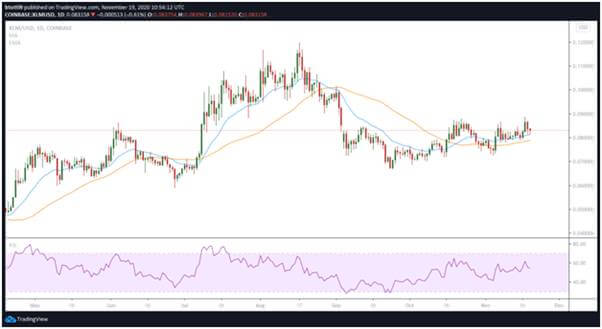
Stellar bulls are likely to push higher if they hold prices above the middle curve of the Bollinger Bands on the daily log. The chart shows that XLM is trading just above the line ($0.080) and the 10-day exponential moving average ($0.0822).

XLM/USD 1-day price chart. Source: TradingView
XLM/USD is also above the 50-SMA and the 20-EMA (daily chart). If bulls hold prices above these levels on a daily close, a run to the upper boundary ($0.0866) could invite more buy-side pressure and provide the energy buyers need to battle sell-side pressure lurking on the upside to $0.12.

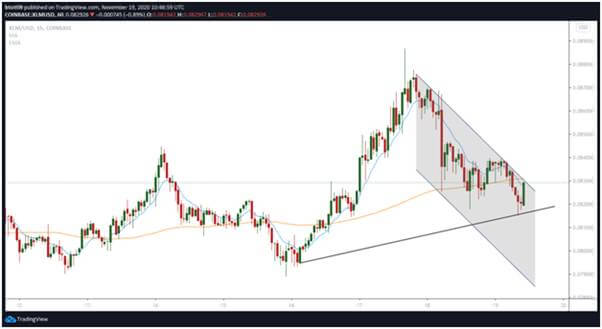
Stellar price 1-hour chart. Source: TradingView
Stellar price is below the 100-SMA and the 50-SMA on the hourly chart, while bulls are battling to break above the 10-day EMA on the log.
From a technical perspective, if the Stellar Lumens token continues on a negative trajectory short term, its price could slip to $0.078 (the 50-SMA on the daily chart). A drop beneath this level is a scenario that will likely encourage the bears, adding to their appetite for downward action.
XLM/USD is currently capped by the upper line of a descending parallel channel, which has acted as a major barrier since the downswing to lows of $0.067 on 23 September.

