TRON (TRX) price has climbed to $0.0251 and could touch $0.03, although it could still drop to lows of $0.023 if the bears take control as suggested by a sell signal on the hourly time frame
The technical outlook suggests that the TRX/USD pair could rally to highs of $0.03 if the bulls strengthen the upward momentum seen in the past few days. The upside followed gains for major coins such as Bitcoin and Ethereum, both of which are looking to hold above major support levels.
TRX/USD
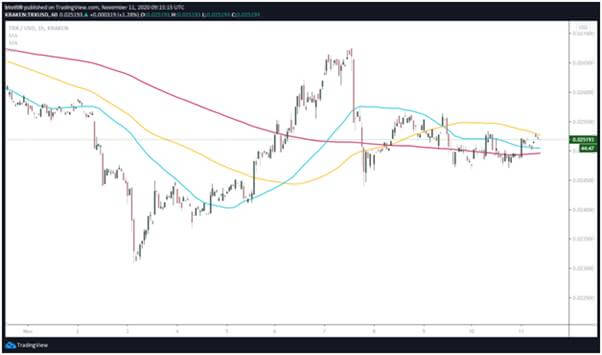
At the time of writing, the native asset on the decentralised content sharing and entertainment platform is changing hands around $0.0251. The price is, however, below the 100-hourly moving average and a continuation of the downward flip could see the bears take full charge, drawing bulls into a battle for control near $0.023.

The hourly chart features a bearish divergence picture as suggested by the MACD and the RSI. The moving average convergence-divergence indicator is suggesting a hidden bearish flip as does the RSI that is beginning to turn south below the middle line.
The 50-SMA and the 200-SMA provide support if the downward pressure holds — the former at $0.0250 and the latter at $0.02496. The upside could see bulls find resistance at the 100 hourly simple moving average located at $0.02527.
TRX/USD 4-hour chart

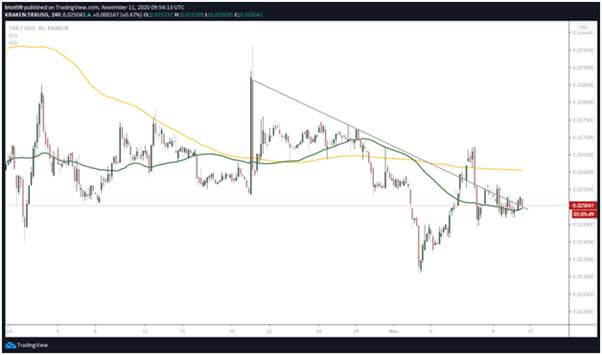
TRON’s price on the 4-hour chart is above the 50-day simple moving average. The area currently provides an immediate support zone at $0.0249, which the bulls must defend aggressively to avoid inviting further downward pressure.
To help the bulls’ case in this scenario, the prices must remain above the descending trendline as seen in the above time-frame. It is an area where TRX/USD traded briefly above this past week, touching highs of $0.0267 on the 6th of November before plunging back below via a low of $0.0244.
If the sell-side pressure mounts short term, the next target for TRX bears could be $0.023.
In short, TRX could dip short term, but an aggressive buy-the-dip move could provide a run to the 200-SMA at $0.0268. Above this level, buyers could eye the barrier near $0.03.

