UNI has surged to a new all-time high of $13.09 on Binance, with bulls likely to target highs of $20 short term
Uniswap (UNI) rose to a new all-time high of $13.09 on Monday morning, continuing the decentralised finance (DeFi) token’s massive upside moves over the weekend.
As UNI/USD reached its milestone, Ethereum (ETH) breached recent resistance levels to hit a new all-time high of $1,467.
At the time of writing, both ETH and UNI have since retreated, although they retain the uptrend outlook. UNI currently trades around $12.03 while ETH/USD is looking to rebound after dropping to lows of $1,400.
UNI/USD
Uniswap bulls are looking to push back above $12.00, with technical indicators suggesting further upsides if prices rally to intraday highs.
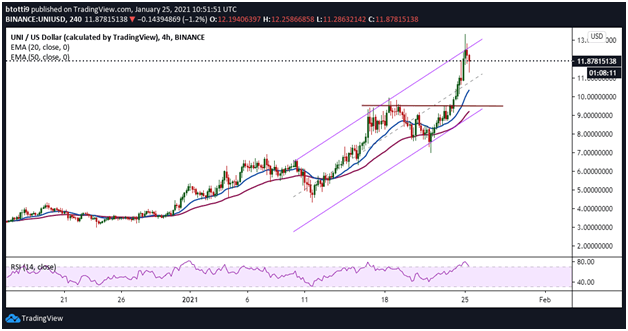
On the 4-hour chart, the price of UNI remains above the 20-day and 50-day EMAs, despite consecutive red candles over the past two sessions. However, as the candlesticks show, bulls are aggressively buying the dip, which is likely occasioned by increased profit taking after the token hit its new all-time high.

UNI/USD 4-hour chart. Source: TradingView
Although the RSI on the above chart is pointing down to suggest short term bearish pressure also remains, the overall picture is bullish. Apart from the RSI indicator trending within overbought conditions, UNI/USD also appears strong above the middle trendline of an ascending parallel channel.
If bulls can continue their aggressive buying, there’s a possibility the next target is to retest the upper boundary of the channel. This means taking prices close to the $13.00 resistance line. A successful breakout above the above level could put UNI/USD in price discovery territory.
Here, psychological targets lie at $15.00 and $20.00 on a strong uptrend.

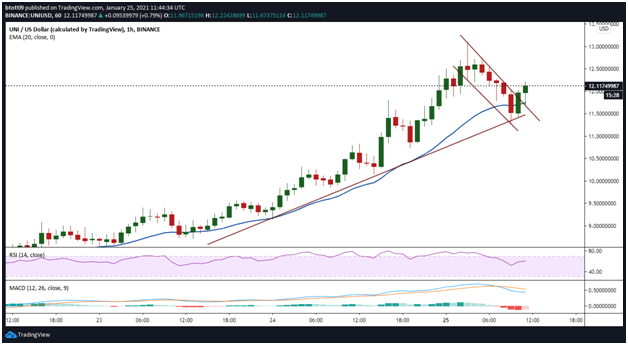
UNI/USD hourly chart. Source: TradingView
The hourly chart suggests a robust support zone has formed near $11.50, with both the hourly RSI and MACD positive. The RSI is upturned and looking to climb further away from the midpoint line. The MACD, on the other hand, is within the bullish zone and suggests a hidden bullish divergence formation as bear strength begins to weaken.
To strengthen the uptrend, bulls need to achieve a daily close above $12.50. Tailwinds around this price level will allow bulls to explore higher as UNI/USD hits price discovery mode.
On the contrary, a retreat from current price levels could see UNI fall to $11.72 (20-day EMA on the hourly chart.)
Further support is at the two exponential moving averages on the 4-hour chart- the 20-day EMA ($10.33) and 50-day EMA ($9.19).

