

The cryptocurrency market is likely to end the week in a bearish situation after overturning the gains recorded over the past few hours
The cryptocurrency market started the week in poor condition, with most coins losing more than 10% of their values within the first few days. However, Bitcoin (BTC) and some of the major altcoins managed to turn things around in the middle of the week as the total market cap approached the $2 trillion mark again.
However, the bears have regained control of the market, and the total market cap has dropped below the $1.9 trillion mark again. For the short term, the bears seem to be in control, and the prices of the cryptocurrencies could drop further in the coming hours.
Bitcoin price outlook
Bitcoin is currently down by 3% over the past 24 hours and is trading above $42k per coin. The BTC/USD 4-hour chart is currently bearish, with the MACD line and the relative strength index (RSI) of 39 both confirming that fact.
If the bearish sentiment continues, BTC could drop towards the first support level at $40,950. An extended period of sell-off for the leading cryptocurrency could see it drop towards the $38k mark, a level it hasn’t seen since early August.
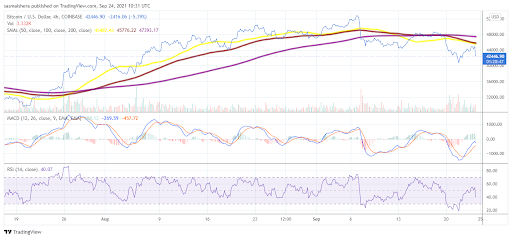
BTC/USD 4-hour chart. Source: TradingView
However, if the bulls regain control, BTC could look to test the resistance point at $44,820 in the coming hours. An extended rally could allow Bitcoin to attempt to reach the second major resistance point at $47,876.
If you would like to buy Bitcoin, please visit our how to buy Bitcoin page
Tezos price outlook
Unlike the broader crypto market, Tezos (XTZ) is currently rallying. The XTZ/USD 4-hour chart is bullish as the MACD line has crossed over into the positive territory. The RSI of 59 means it is heading into the oversold region.
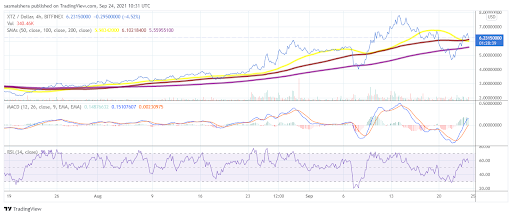
XTZ/USD 4-hour chart. Source: TradingView
If it maintains its bullish nature, XTZ could test the $6.9 resistance point in the coming hours. An extended rally would allow it to touch the $7.5 high over the next few hours or days. However, if the bears regain control, XTZ could fall towards its 100-day SMA located at $6.10. Unless there is an extended sell-off, the support level established at $5.5 or its 200-day SMA should limit further downward movement.
If you would like to buy Tezos, please visit our how to buy Tezos page
DASH price outlook
The DASH/USD 4-hour chart is currently in the bearish zone, and the cryptocurrency could record further losses over the coming hours. If the existing market condition persists, DASH could test the first major support level at $157 over the next few hours. An extended bearish run could see DASH risk dropping below the $150 mark for the first time since early August.
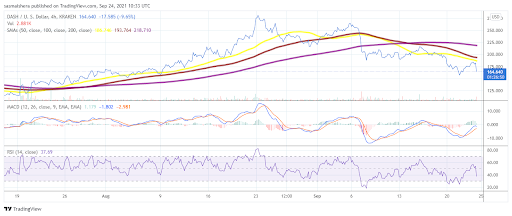
DASH/USD 4-hour chart. Source: TradingView
However, if the broader market recovers, DASH could test the first resistance point at $184. It could go higher towards the $200 mark if there is an extended run from the broader cryptocurrency market.