As the end of the year closes by, Bitcoin price returned to gains boosted by China news on cryptocurrency mining, Blockchain adoption and the launch of its state-supported stablecoin. However, bulls weren’t able to push the crypto leader above the psychological level of $ 10,000. Bitcoin is currently 35 % below its highs this year, which flirted close to the 14 K level. This article presents a daily technical analysis of Bitcoin that might be compared to opinion, forecasts and observations from different experts.

Bitcoin: How the Price Has Evolved in 2019?
Bitcoin continues to show its volatile nature during a busy year where cryptocurrencies are going even more mainstream on the political and economic spheres. The launch of Bakkt, the announcement of Facebook Libra project, the brake that the SEC put on Telegram’s cryptocurrency and the renewed position of China on crypto have been some of the news with a significant impact on the price of Nakamoto’s invention. At edition time, the bulls fail to defend the $ 9,000 level after a bull run on China, that helped BTC to fly above the 10 K wall. This places Bitcoin 35 % down from this year highs; nonetheless, its gains remain over 180 % (from year lows).
In statistical terms, Bitcoin has been profitable on 63.8 % days this year (taking price close as reference). Beyond the news on decentralisation and digital currency, crypto markets will keep sensible on political and economic junctures as Brexit resolution, the trade war between China and the US, and recession risks increasing. Thus, technical prospects are subject to change and volatility is the order of the day. Crypto communities start to call year-end forecasts as the $ 10,000 resistance comes into place. Is Bitcoin going to close above or below?
November Technical Analysis: a Death Cross Wakes Up the Bears
The decision of selling or buying Bitcoin keeps living on a space where the room for errors is prevalent—just as with other risky financial instruments—. Besides the technical elements that are really rooted in our analysis, it is important to mention that there’s a thin line for volatility and these levels are far from precise. Our TA shows:
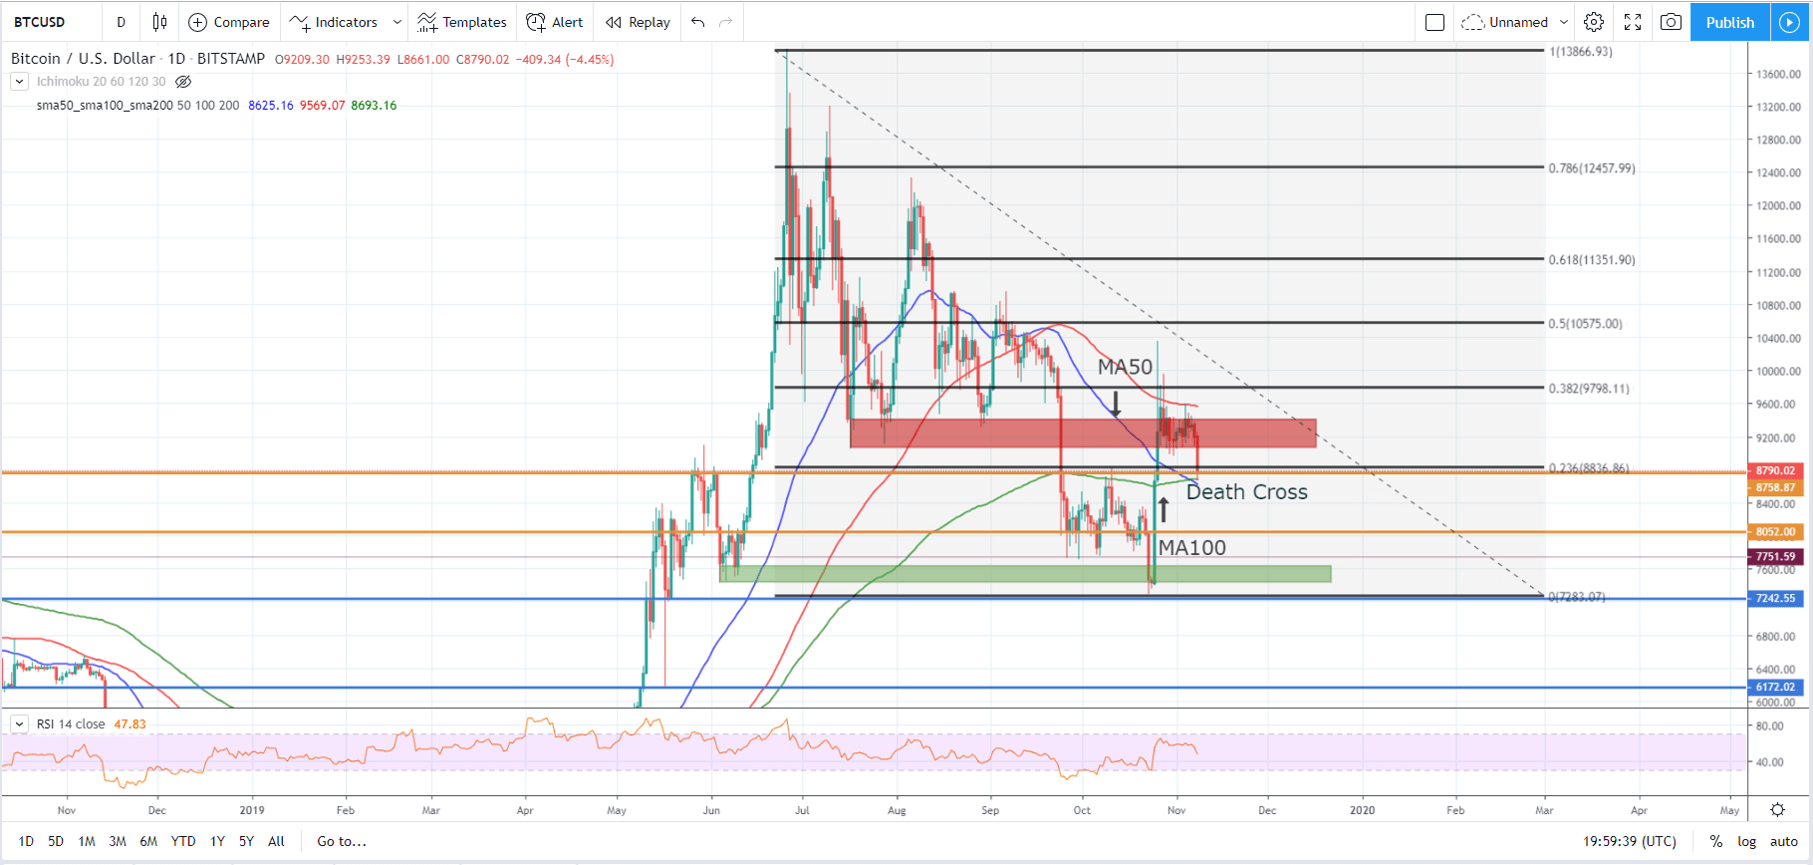
- Today’s session takes place with a sharp drop of more than 6 % on Bitcoin. It happens as the bulls weren’t able to break the resistance around USD 9,400. This S/R level acted as significant support on the second quarter.
- Even though the bulls fought for consolidation above that level, daily closes show that buying interest wasn’t enough to close aloft.
- Many technical indicators provide valuable information so they’re included on this chart. The moving averages at different speeds (50, 100 & 200 days) give a lot of data.
- First of all, the chart makes it clear how the MA100 has acted as resistance along with the daily candle closes. On the other hand, BTC runs into clear support close to USD 8,750. This level matches the MA200.
- Additionally, the MAs outline a death cross, a bearish signal that could change the bias if confirmed. This crossing is clear as the 50-day rapid moving average crosses the MA200.
- Bearish scenario: if the bearish profile is confirmed, BTC may retest multiple levels that are clear by basic candle chartism. Fibonacci retracements confirm them. They’re not exact, but the levels of interest might be around $ 8,050; $ 7,430~7,620 and $ 7,240. If these levels don’t hold, BTC might test a solid support for a second time since the bullish breakout from may (on the $ 6,000 lows).
- Bullish scenario: this would require a reversion of the status quo, a situation where the death cross might become into a golden cross just like it happened to Facebook stocks in 2018. For further confirmation, BTC should ideally have a daily/weekly close above the resistance on the red rectangle. In this case, Fibonacci shows some pretty accurate levels of resistance.
- The RSI is on a neutral-zone and it has oxygen for movements in any direction.

Experts’ Insights: 2019 Year-End Forecast for Bitcoin
In this section, we’ve gathered some expert’s predictions and opinions. As usual, there is no consensus and the outlooks are diverse for the year-end Bitcoin price.
- A tweet by Bloomberg TicTock posted details on a CME Group research. The experts from the financial firm believe that Bitcoin has further space to grow on another rally before year-end. According to their data, current levels might boost buying interest and other situations such as Fed cuts on interest rates will raise concerns about rates of return.”Analysts are predicting a potential move as high as $ 15,000.”
- Tom Lee, Fundstrat CEO and co-founder, keeps on taking risks to forecast Bitcoin price despite his multiple misconceptions. In a recent interview with CNBC, the expert said that Bitcoin is ready for new highs. He believes that this bullish outlook is conditioned to the scenario of new highs for the US stock market (specifically, the S&P 500). In another talk, he said that Bitcoin has the potential to reach the $ 40,000 mark.
- Mike McGlone, an analyst from Bloomberg Intelligence, said in October that the transition from a bear market to a bull market has finished. The expert suggests that the instrument might have “an extended consolidation period, but with positive bias for similar reasons as gold.”
- The same article states that the Global Strength Indicator (GTI) gave its first buying signal since December 2018, saying that “holding of the $8,000 level is adding to further optimism that could catapult the coin higher.”
- In an analysis from FX Street, the author claims that the bulls “lost their chance” to confirm Bitcoin’s positive bias; however, experts’ predictions are still bullish for year-end.

