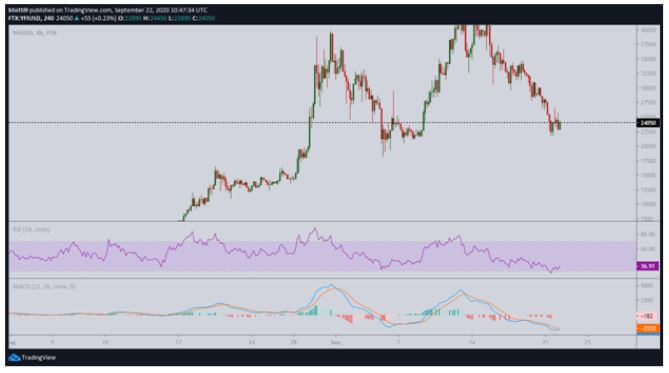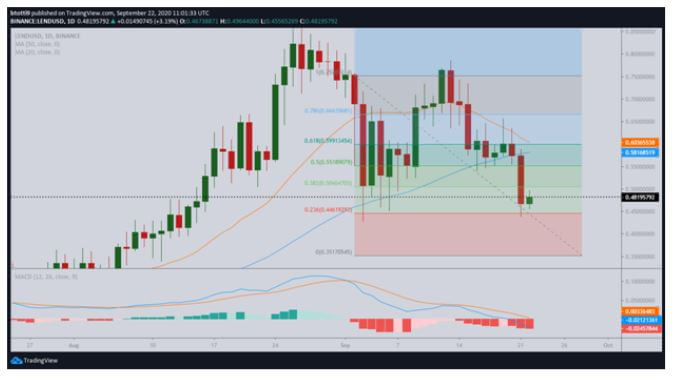
YFI/USD and LEND/USD are 46% and 50% off their peak prices in August.
Tokens in the decentralized finance (DeFi) space continue to post losses as the crypto market hits price correction phase. According to the ranking index on CoinMarketCap, all the top 10 DeFi tokens are trading lower on the day, continuing the downtrend seen over the past few days.
The losses have also seen the total value locked in decentralized finance protocols and smart contracts drop. As per DeFi Pulse, the TVL has dropped from highs of $13.2 billion to around $9.38 billion as of September 22.
Over several months, yield farming and liquidity tokens attracted a lot of attention from crypto traders, with many posting remarkable rallies to hit successive all-time highs. And although the sectors still command a growing user base, the short term picture indicates the majority of the tokens might continue to tank hard.
As it is, some of the tokens are already hitting lows that put their respective price nearly 50% off all-time highs set not long ago.
Yearn.finance
YFI/USD shot to highs of $43,000 on September 12th, raking in thousands of percentage points in gains. The last 7 days have however seen the token dump to lows of $20,000 to fall nearly 46% off its peak.
The Ethereum-based token is up 3.4% in the past 24 hours but remains in the red over weekly charts as price begins to inch towards $25,000. A look at the chart shows suggests YFI/USD is headed for a breakout above a falling wedge pattern. There is a hidden bullish divergence for the MACD, while the RSI is just beginning to turn away from oversold territory. If bulls hold the advantage as seen in the 4-hour charts, the $30,000 target could be achievable short term.

Aave
Aave price is down 10% on the day and about 29.8% over the past 7 days. One of DeFi’s most popular cryptocurrencies, LEND has endured a torrid few days after rallying to highs of $0.92 in August.
After hitting a wall near $1.00, LEND/USD has slipped to lows of $0.46, shipping out almost 50% of its value since hitting an all-time high.
On the technical analysis front, bears appear to hold the upper hand short term. The daily chart has the MACD edging lower, with any bullish advances likely to be capped by the 20 MA and 50 MA. A breakout though will see LEND/USD bulls aim for highs around $0.60.

On the downside, bulls have support at the 100 MA, the 23.6% Fibonacci retracement on the downswing to $0.44 from highs of $0.90.

