Bitcoin (BTC) has increased its market dominance as it made gains while most cryptocurrencies consolidated. At the same time, XRP got crushed by the news of the SEC officially filing a lawsuit against Ripple and its two executives, further adding to Bitcoin’s good standing
The largest cryptocurrency by market cap is currently trading sideways, and only managed to increase its price by a couple of percent in the past 24 hours. However, XRP’s SEC-lawsuit-induced crash, as well as overall market stagnation, has allowed Bitcoin to approach the 70% market dominance mark.
Bitcoin’s overall outlook is bullish, especially after taking some time to properly consolidate. When taking a look at the week-over-week performance, BTC has posted gains 1.48%, while ETH lost 6.28%. On the other hand, XRP lost 37.41% in the same period.
At the time of writing, BTC is trading for $23,500, which is a gain of 22.46% when compared to its previous month’s value.
BTC/USD
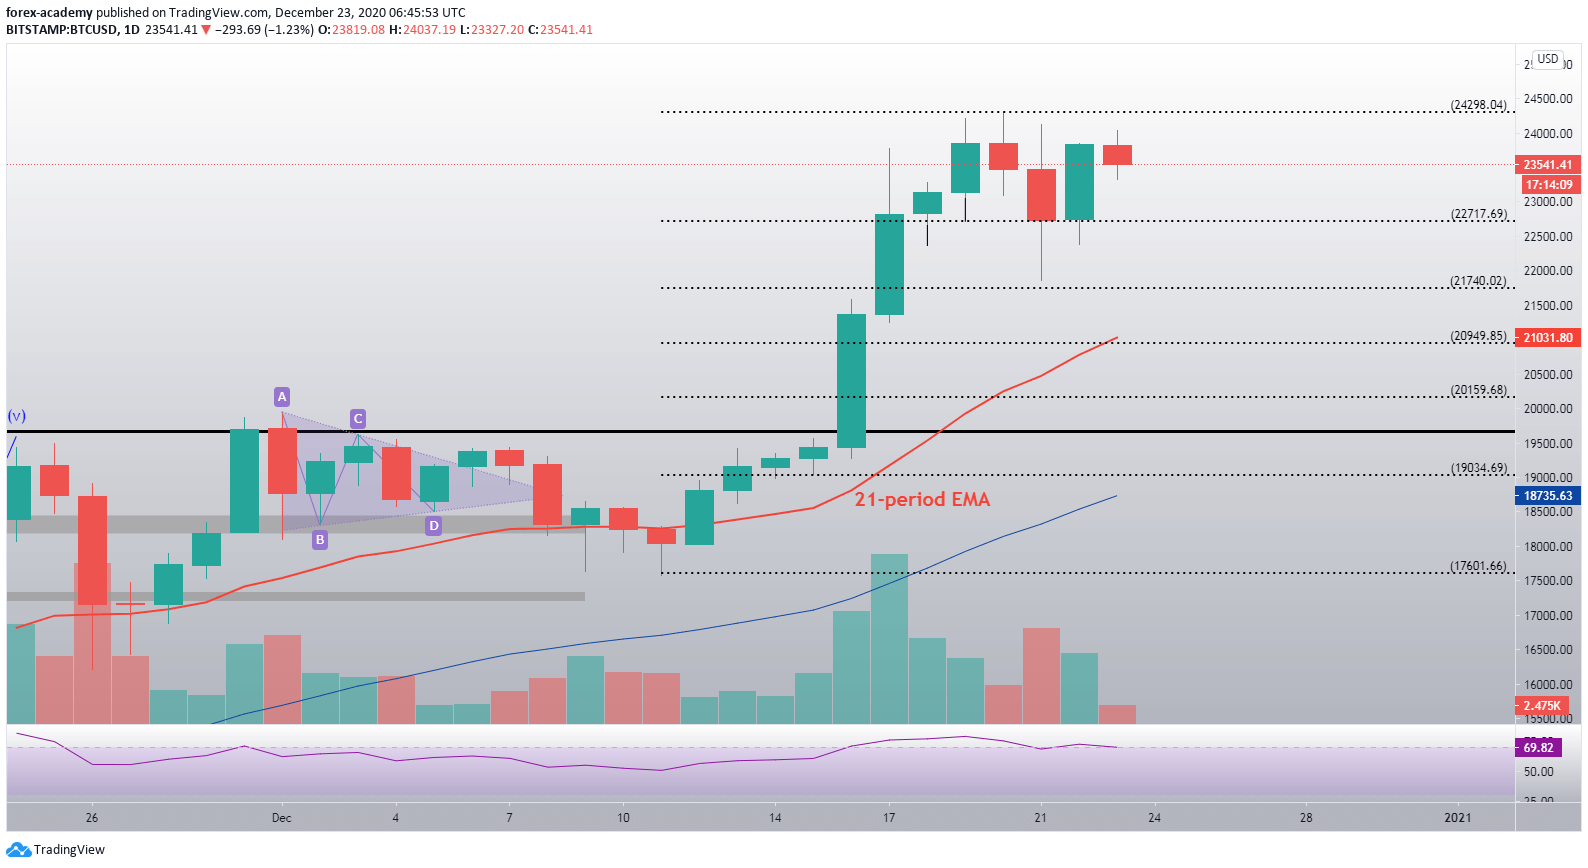
Taking a look at the daily chart, Bitcoin entered a consolidation phase on 20 December after it hit the $24,300 resistance level. The RSI and volume are descending, while the price remains relatively high; usually great predictors of future movement.
While it is true that Bitcoin rarely consolidates on decreasing volume for a long time, the current trading range is quite wide, and the largest cryptocurrency by market cap might stay within it for some time. However, there is no denying that the outlook is bullish. If the price manages to break the $24,300 level, BTC will enter price discovery mode once again.
However, if the cryptocurrency retraces, it will be met with a number of strong support levels, including $22,720, $21,740 and the zone around $20,000.
 BTC/USD daily price chart. Source: TradingView
The technical overview shows that Bitcoin’s daily RSI indicator is currently leaving the overbought territory as the price stays on the same level. This is a very bullish indicator, especially if paired up with descending volume. With these indicators combined, there is a much stronger probability of the next move being a bullish one, rather than a bearish one.
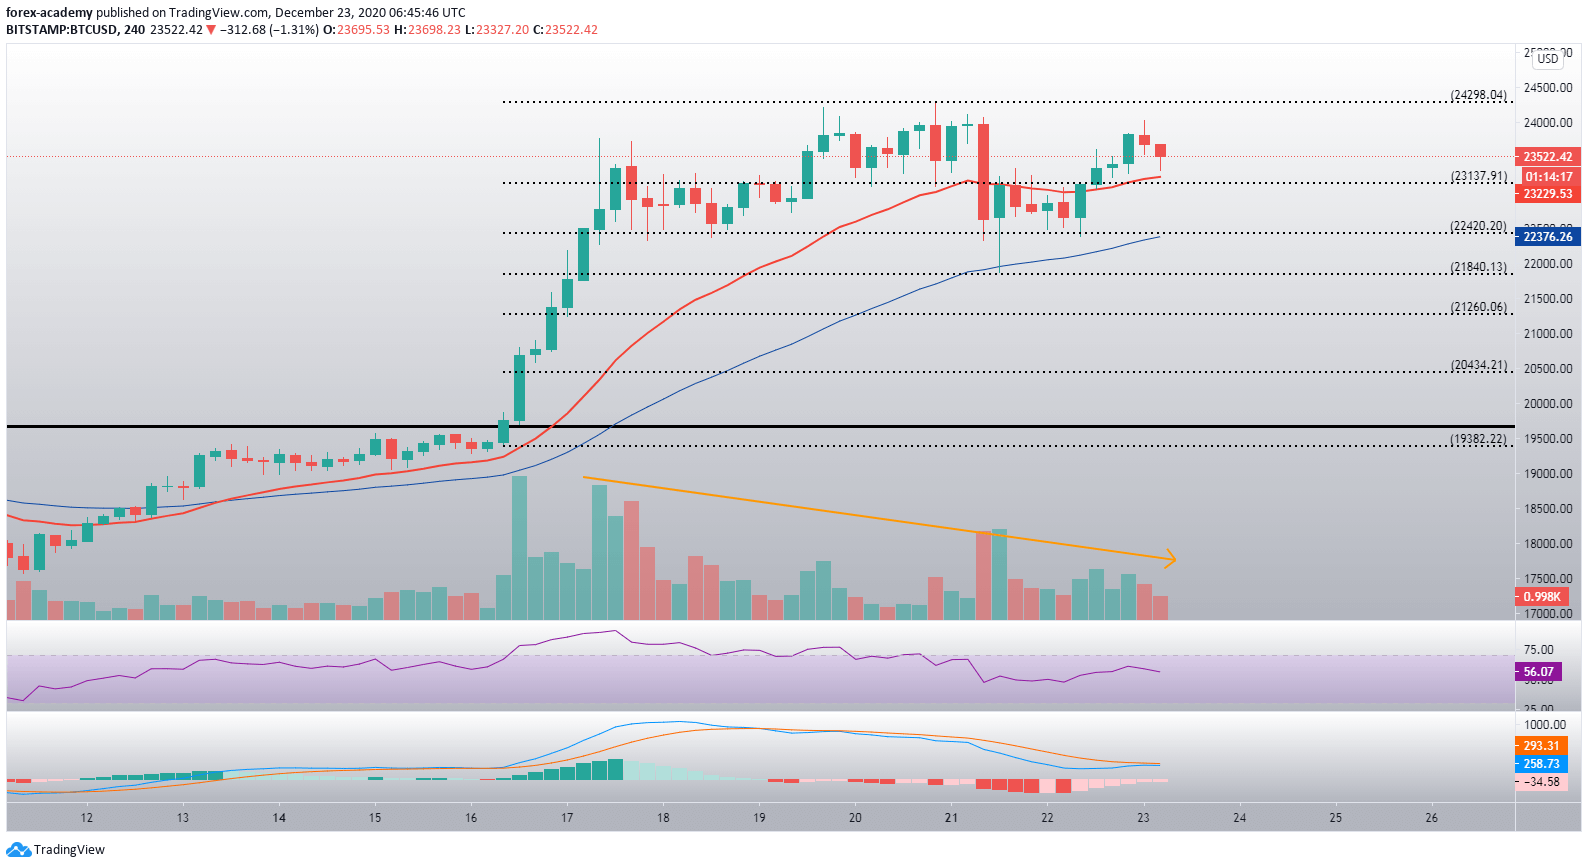
 BTC/USD 1-hour chart. Source: TradingView
When taking a look at the 4-hour time-frame, we see Bitcoin’s movement alongside the channel bound by $22,420 and $24,300. It’s also important to note that the 4-hour 21-period moving average also plays a great role in the short-term moves of the largest cryptocurrency by market cap.

