Bitcoin (BTC) has created a new all-time high right below $36k, but quickly retraced to sub-35k levels
The largest cryptocurrency by market cap has continued its bull run, creating a new all-time high of $35,879 at one point. However, bears reached the point of exhaustion, and the price pulled back to sub-35,000 levels, right under the previous all-time high of $34,800. This uptick in price might have come as a result of the US Office of the Comptroller of the Currency publishing guidance enabling federally chartered banks to use stablecoins as well as public blockchains for settlement.
Bitcoin’s overall outlook is incredibly bullish, but some analysts are calling for a “much-needed” retracement. BTC managed to score weekly gains of 19.43%, while ETH managed to gain a whopping 52.79%. On the other hand, LTC gained 28.60% in the same period.
At the time of writing, BTC is trading for $34,620, representing a price increase of 62.14% compared to the previous month’s value.
BTC/USD
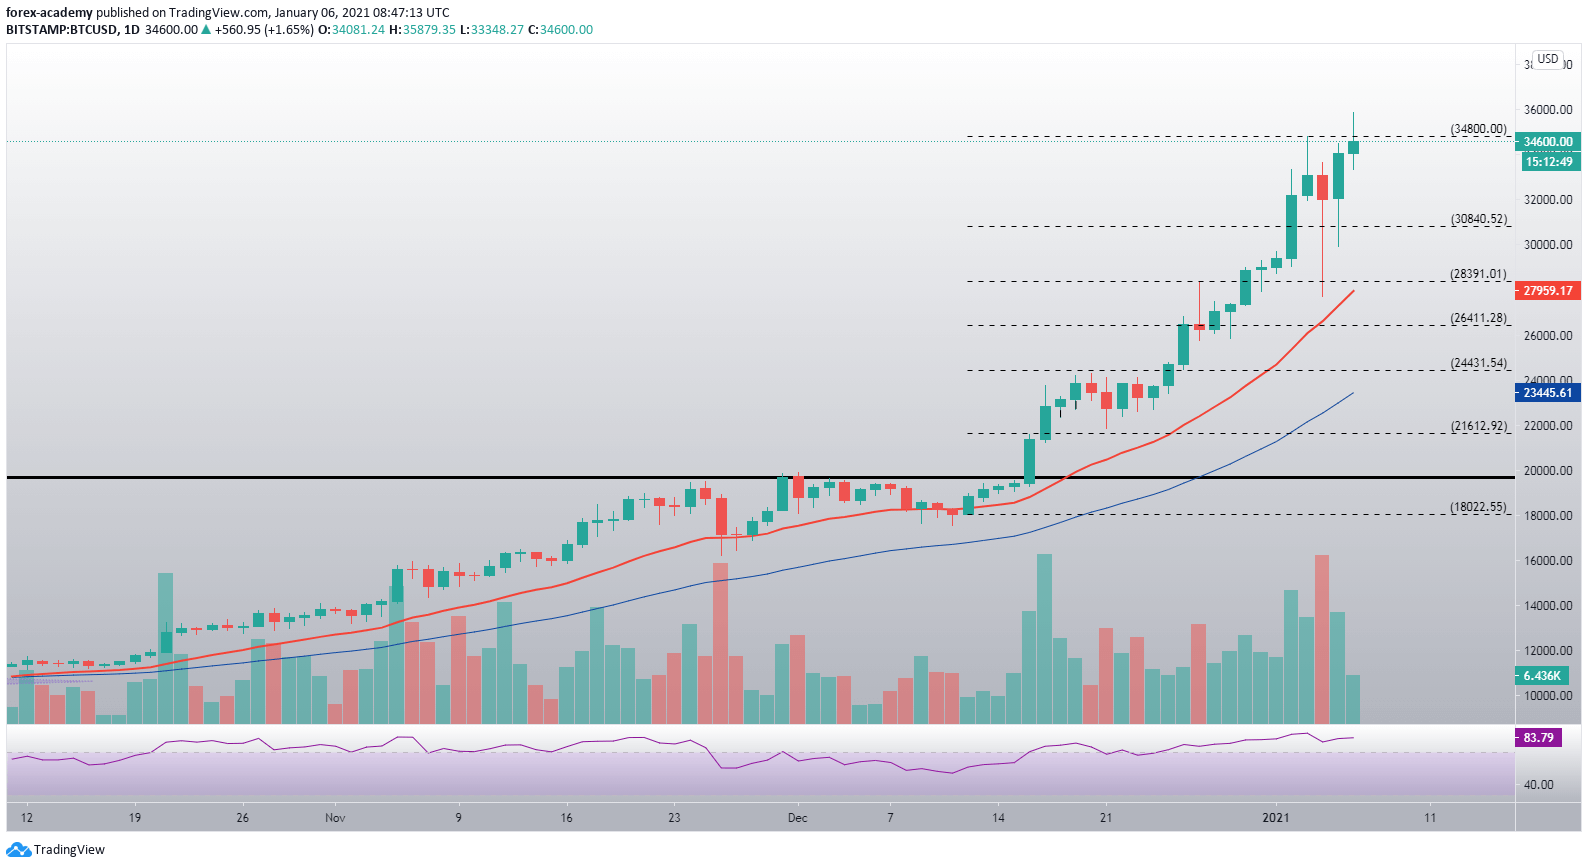
Taking a look at the daily chart, the largest cryptocurrency by market cap reacted positively to the hammer candle, posting one large green candle right next to it, as well as reaching new all-time highs the day after. While the new all-time high levels did not hold this time, the overall strong volume is a good indicator of the bull run not being over yet.
Bitcoin faces strong resistance above the $34,800 level, but has no strong support before $30,840.
 BTC/USD daily price chart. Source: TradingView
BTC’s RSI daily time frame indicator continued in the overbought area, with its current value sitting at 83.79.
With volume still being incredibly high, a sudden downturn and volatility are more likely than a sideways trading pattern at the moment.
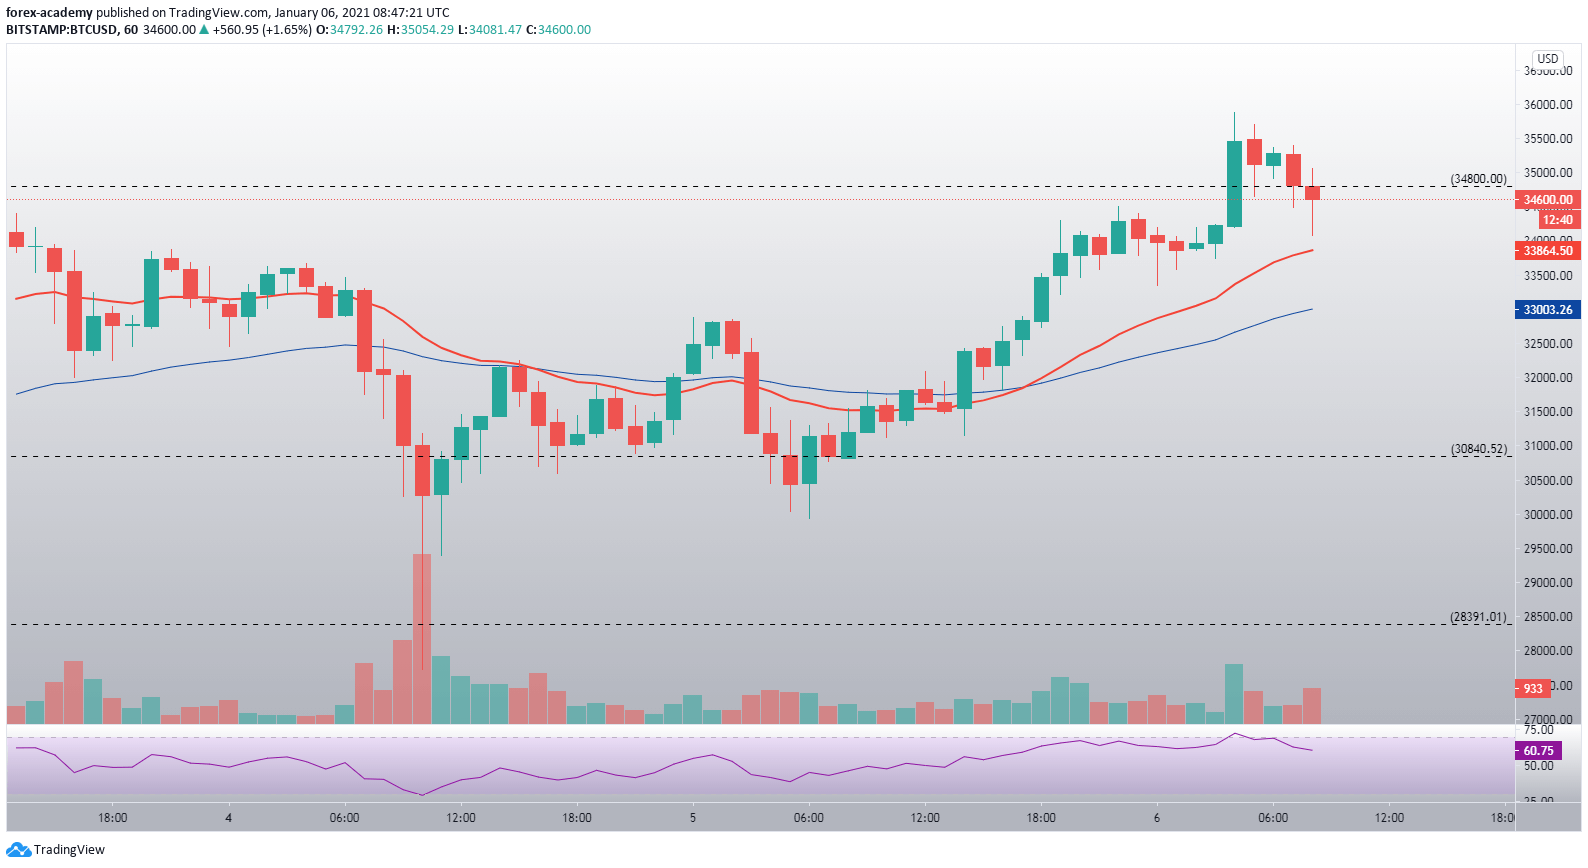
 BTC/USD 1-hour chart. Source: TradingView
Bitcoin’s hourly time-frame shows how Bitcoin escaped the “pivot zone” we mentioned yesterday, and how this resulted in a steady push towards the new all-time highs. Bitcoin has retraced below $34,800 at the moment, giving the RSI oscillator some breathing time below the overbought area.
If Bitcoin attempts a move towards the downside, the hourly 21-period and 50-period moving averages will most likely play a major role in future price development.

