Bitcoin (BTC)
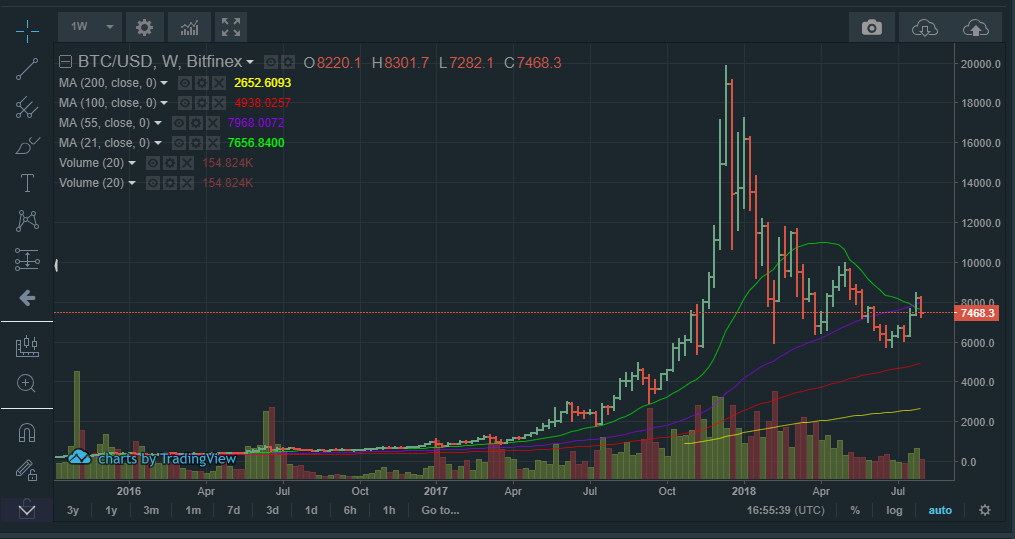
Bitcoin has had a bearish week, and has broken below $7500, losing $1000 from its recent high of $8500. From the weekly charts, it is clear that the bearish momentum might continue all through the weekend.
That’s because it has formed a bearish engulfing, which usually signifies that buyers have lost their hold on the market. It has also broken below the 55-day moving average, which is a strong bearish signal.
If sellers continue to dominate this market, chances are that bitcoin (BTC) will drop to $5800, a price level that has offered support in the recent past. A break below this could see bitcoin (BTC) test $4800 in the near-term.
 In the day, bitcoin has broken below the 100-day moving average at $7500. This is a bearish signal, one that could see bitcoin test $6800 in the day.
At this point, everything points to a scenario where a short order would make the most sense, since it has a better risk/reward potential. However, in the scenario that bitcoin reverses, it could hit $8000, a price level that is now acting as a resistance point.
Ethereum (ETH)
In the week, Ethereum has been strongly bearish, and looks set to test new lows precisely because it has broken below a key support level at $441.
If this week’s extended bearish candle continues, chances are that Ethereum (ETH) will drop to $368, which is a long-term support level. A break below it could see Ethereum (ETH) drop to $325 along the 100-day moving average. Basically, Ethereum is entering into long-term bear territory, and could remain there for a while, before we see a price consolidation, then a bull run.
 The day charts paint a similar scenario. Ethereum (ETH) broke below a key support level at $425 four days ago, an indicator that bears are now in control of the Ethereum market, and selling volumes are likely to increase over time.
However, in the last few hours, there has been a pull-back from $399 to $410. This is a minor retracement and will most likely be sold, driving the price even lower. Shorting Ethereum (ETH) at this point makes sense from a technical perspective. However, in crypto things move fast, so risk management is critical, since it could always reverse without warning.
NEO (NEO)
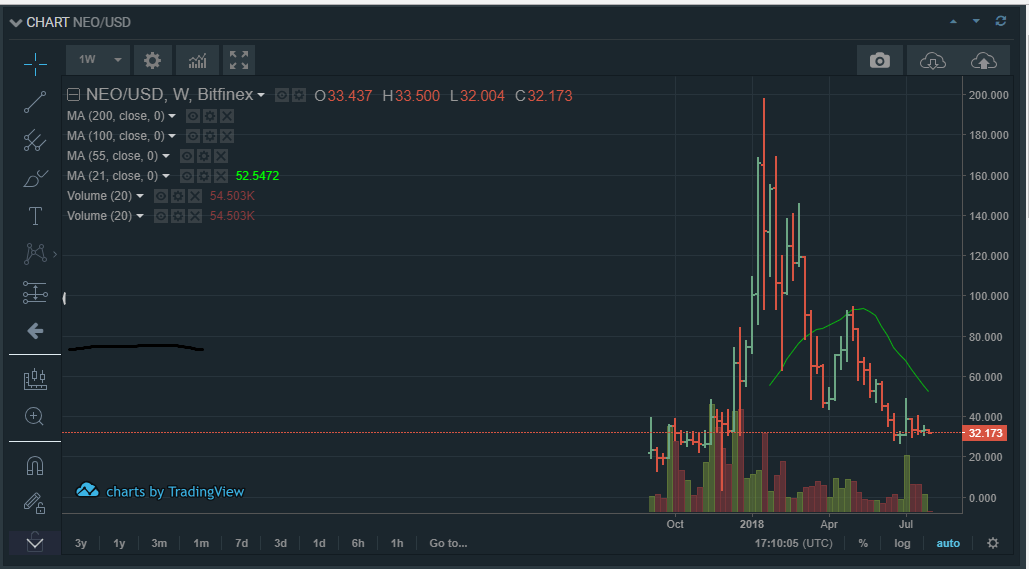
A look at the weekly charts shows that NEO (NEO) is now firmly in long-term bear territory. It has broken the market structure by dropping below a multi-year support level at $28.

From this setup, NEO (NEO) will most likely drop a little further before entering into a long-term range. That’s because below $25, volumes will decline as buyers disappear from the market. Sellers too might stay away out of the fear that it might have hit the bottom, and is about to reverse.
In the day, NEO (NEO) has been making lower lows, albeit with low market volumes, confirming the weekly chart that it could be entering into a long-term range. Therefore, in the short-term NEO (NEO) is likely to favor sellers, though the returns may not be that high due to a huge decline in volumes.

