The Bitcoin price index closed at $9,453 on May 31 to end the month above a key level for the first time in nine months. Entering the new month at these levels maintains Bitcoin’s positive outlook in the near term, signalling the potential for upward movement in June
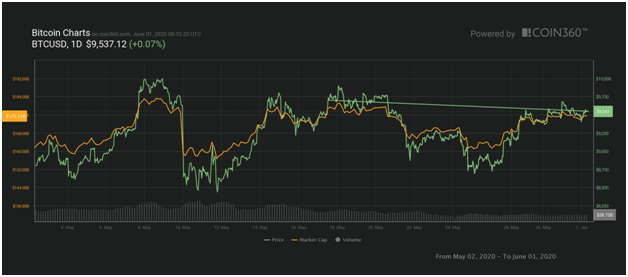
Bitcoin had an eventful May: a halving on May 11, a breakout above $10,000 and the movement of Bitcoin mined in 2009 causing a price crash of nearly 15%.
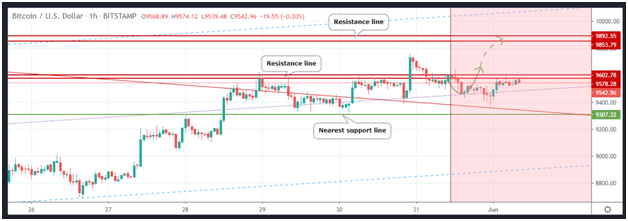
Bulls, however, rallied from a retest of $8,100 to come tantalisingly close to $10k. As of time of writing, Bitcoin is trying to inch above $9,500 for a retest of prices at resistances around $9,800.

Bitcoin’s halving was a highly anticipated event, not least for the reduction in block rewards and its potential upward effect on price. But the top cryptocurrency saw its value fail to rally post-halving, with struggles coinciding with a decline in hash rate, as miners shifted to rival networks Bitcoin Cash and Bitcoin SV.
Where does Bitcoin go from here?
Analysts have pointed out that a monthly close around August 31 2019 levels could be an important indicator as to what direction the crypto market takes medium term.
The market targeted a close above $9,000 to keep the support levels at $8,750 intact. Crucially, the cryptocurrency kept the candle above $9,400, to mark the first time since August 2019 that the monthly Bitcoin price index closed above $9,360.
Price rejections at $9,360 on the monthly close have, in the past, seen the cryptocurrency dive to new lows; the lowest of the year so far was the $3,800 level seen following the crash on March 12. It is the same level at which a rejection accelerated the downtrend that saw Bitcoin drop to lows of $3k, as a year-long bear market crashed prices in 2018.
In May, Bitcoin bulls bounced between lows of $8,100 and highs of $9,966, with a bearish retest playing out the support-resistance flip. After breaking above $9k the crypto raced to a monthly high before a retest of support turned levels above $9k and $9.5k into two main resistance zones.

An uptrend should see Bitcoin clear hurdles at $9,750 and $9,850 to aim for the coveted $10,000 mark. The bulls, however, have to clear resistance at $9,600, with rejections at this level likely to rely first on immediate support at $9,300. Current price levels are critical, as they keep last weekend’s high of $9,745 within sight.
Bitcoin is currently trading within this range: so a breakout could see it rally higher, but a pullback means lower price levels are still at play.

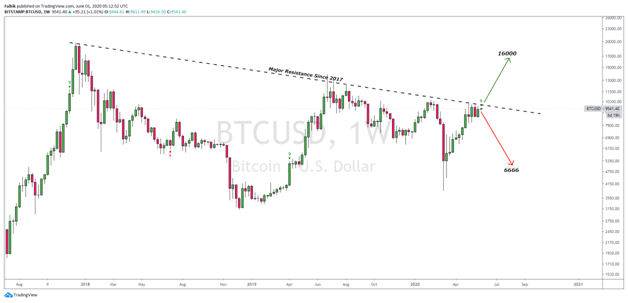
According to this Bitcoin price chart, a major bull run could materialise above $10k, sending BTC/USD to highs of $16k in 2020. However, if a sustained dip occurs in the coming weeks, prices could hit levels around $6k.
Traders are thus watching out for $10,555 as a critical level that could catalyze a bullish trend.

