Bitcoin soared more than 12% to hit a high of $11,395, with dominance in the market surging to 64%
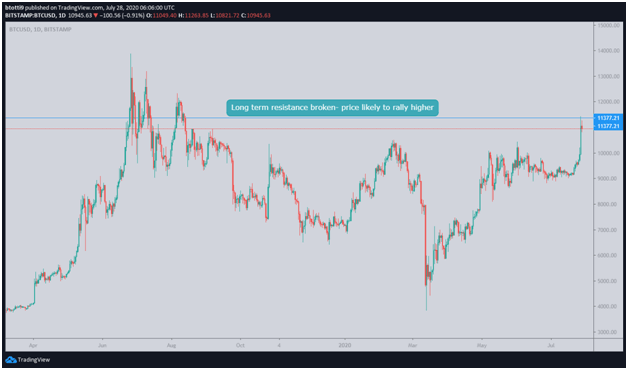
Bitcoin has breached $11,000, rallying nearly 13% in 24 hours on its way to a high of $11,395. Bitcoin closed above $11k yesterday, establishing a bullish bias for investors eyeing an extended upside.
A close at $11,032 also meant Bitcoin’s $1,095 candle on the daily chart was the best intraday action since April 2019.
The spike represents a break of long term resistance around $11,377, as can be seen in the chart below.
Although momentum for the top-ranked cryptocurrency has slightly slowed down as of writing, bulls are determined to hit a new high near $12,000.

According to Josh Rager from Blockroots, a similar move in April of last year that included a $1k candle was responsible for bulls pushing higher and saw the 2018-2019 bear market come to a halt.
Bitcoin’s on-chain activity has also seen a significant surge in the last few days, especially after BTC/USD broke above the $9,500 resistance line enroute to breaching $10k. According to data from Glassnode, exchange inflows and outflows have spiked 52.20% and 58.34% respectively in the past 24 hours.

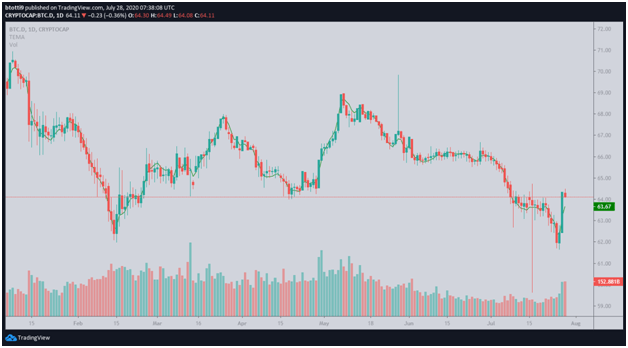
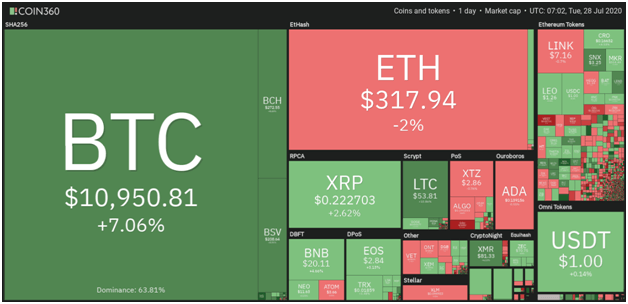
Bitcoin dominance has also surged in the last two days as most altcoins continued to battle increased sell-off pressure. An indicator of increased interest in the leading cryptocurrency, the dominance metric, has spiked above 64% in the past 24 hours as more buyers enter the Bitcoin market.

The dominance index had recently sunk below 62% but crucially stayed above 61.5%, which marks the last time BTC/USD traded near $13,900 highs.
Importantly, every time dominance has sunk below 62%, Bitcoin has rallied for several weeks afterward.
As of writing, the BTC/USD pair is trading around $10,950 and is more than 7% up on the day. Bulls will however eye another close above $11k to place themselves in a better position to push higher.
A look at the charts shows that if Bitcoin hits increased buying volume, the digital asset could rally unimpeded to $12,300. This is the level likely to offer the first major resistance area following higher prices.
The RSI is showing bullish signs despite pricking 82 points on the daily chart. The indicator is also overbought on the weekly charts but it’s yet to print into overextended territory.
The MACD is similarly bullish on both the daily and weekly price charts, with the major barriers to any upside above August 2019 highs near $13k.

