

Litecoin pushed more than 10% into the green following Bitcoin’s run to $11k
Crypto market outlook
Bitcoin’s latest spike in trading price is having a positive impact on that of Litecoin, the altcoin that is often dubbed silver to the crypto king’s gold.
While Ethereum has struggled in the last few hours after trailing Bitcoin’s march to $10k, Litecoin has broken out of its tight channel to post a remarkable upside over the past 48 hours.
ETH/USD has soared by more than 30% over the past week to trade above $330. However, increased selling pressure during the Asian trading session has pushed its price about 3% down on the day to currently see it exchange hands at $315.
The price of Ripple’s XRP token is up by 2.3% in the past 24 hours, while BCH/USD and BSV/USD have both spiked by nearly 6%.
Litecoin is nonetheless seeing the most gains, with the LTC/USD pair spiking more than 10% in the past 24 hours.
As of writing, the pair is trading at $53.50, so bulls are likely to aim at consolidating support above $50 to help propel the price higher should Bitcoin explode above $12,000.
Litecoin price analysis
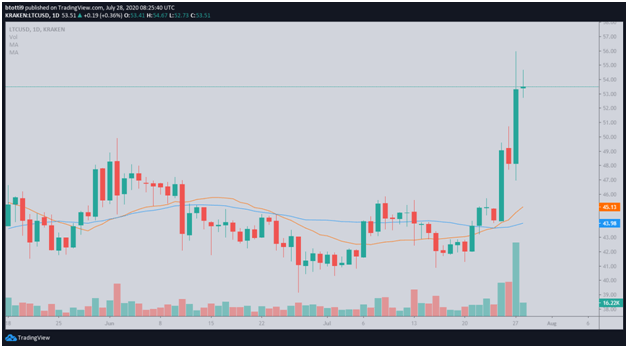
Similar to Bitcoin, the price of Litecoin has also just broken out of a tight channel that had capped prices for the past several weeks. The surge above $50 is the first time the cryptocurrency has traded above the level since March 8, 2020, and represents LTC/USD’s best period since the run from lows of $40 to highs of $49 at the end of April.
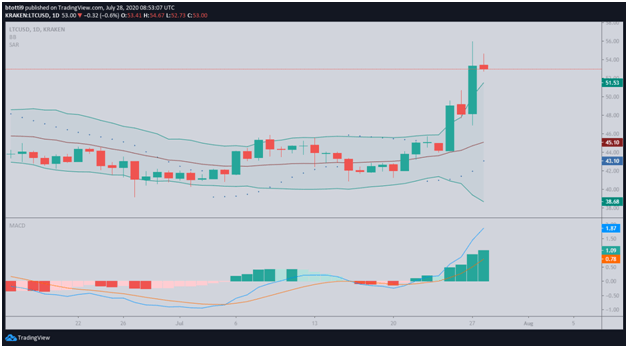
LTC/USD on the upside will very much follow the pattern of higher highs and higher lows that Bitcoin posts. Key price levels are the resistances at $57.107, $61.208, and $66.38. Above that, Litecoin bulls face minimal resistance and the price could hit February highs of $83.
The technical picture is strengthened by the MACD indicator that is well-placed above the Signal line. The Parabolic SAR on the daily chart is also bullish for the altcoin, with the dotted markers giving it room to expand as they cut well below the price candles.
However, a run to higher price levels depends on whether bulls will hold gains above $50. If there’s a bearish breakdown, bulls may rely on major support at $48.179 and $43.00. These levels are critical to keeping levels where they are to avoid a scenario where a rejection sends prices back below a long term descending trendline.