Celsius (CEL) and Theta (THETA) are among crypto’s biggest gainers on the day, while The Graph (GRT) has slowed down
Celsius, Theta, and The Graph are among several medium and small-cap altcoins that surged as traders looked to diversify their portfolios away from Bitcoin (BTC), Ethereum (ETH) and Litecoin (LTC). While the CEL and THETA tokens continue to rise, GRT has hit massive resistance.
CEL/USD
Celsius has recently received a boost from an audit by blockchain security platform Chainalysis.
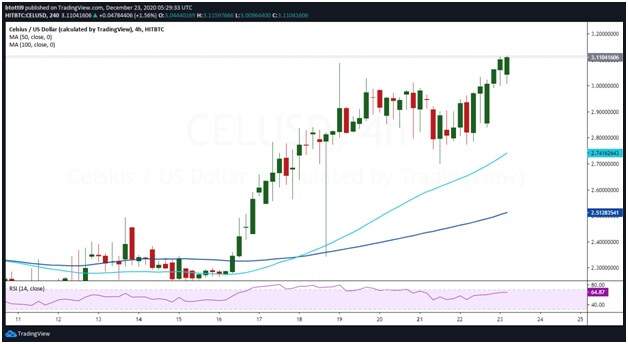
The CEL token has also seen an uptick that has pushed its price to highs of $3.11. With prices up by more than 8% on the day and over 36% in seven days, the steady climb could see CEL/USD break to $3.80.
 CEL/USD daily chart. Source: TradingView
The CEL/USD pair has not dipped to 50-SMA and 100-SMA levels since crossing the levels in mid-December.
If bulls fail to hold the $3.00 level, a downward move may take CEL to the $2.74 and $2.53 price levels. The main support zone is around $2.30, assuming sell-side pressure manages to weaken bulls to that extent.
THETA/USD
The rollout of decentralised video streaming app Theta Edgecast and the addition of smart contract capabilities on the Theta blockchain has recently helped THETA price.
Theta also plans to introduce staking in its mainnet 3.0 in 2021, which adds to the fundamental factors pushing investors towards the token.
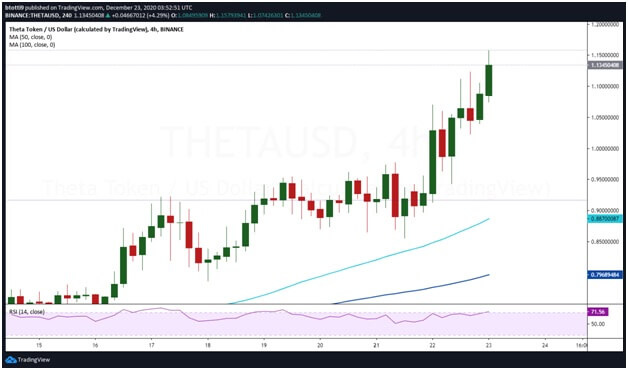
THETA price has spiked by about 17% at the time of writing and by more than 46% this past week. The uptrend has seen the THETA/USD pair surge from lows of $0.90 on 21 December to intraday highs of $1.15 during the Asian trading session.
 THETA/USD daily chart. Source: TradingView
With the price above the $1.00 level, bulls are hungry for more. The RSI is rising into the overbought territory, although the action could slow down if traders start taking profits.
If the bulls sustain the upside pressure, a break above $1.20 would highlight the next target at $1.40.
On the downside, the $0.90, the 50-SMA ($0.88) and the 100-SMA ($0.79) provide crucial support levels.
GRT/USD
The price uptick for Graph Network (GRT) has benefitted from its mainnet launch and the listing on major cryptocurrency exchanges.
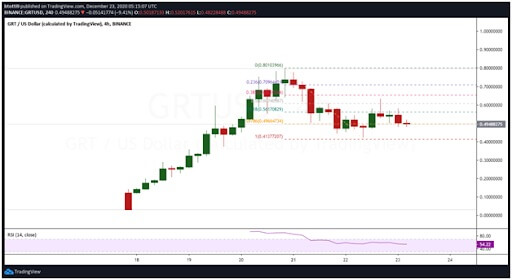
The GRT token on the 4-hour chart shows that bulls have hit a snag after an impressive run over the past few days.
The surge to an intraday high at $0.79 was quickly followed by a series of dips to lows of $0.42.
 GRT/USD daily chart. Source: TradingView
GRT/USD pair failed to break the 61.8% Fibonacci retracement level at $0.56 during the past few sessions. Bulls are also currently fighting sellers at the 78.6% Fibonacci retracement level at $0.49. If the decline holds, the next stop for the bears could be at the $0.41 level.
The RSI remains above the midpoint around 54 to suggest bulls can still resume the uptrend. The 50% Fibonacci retracement level ($0.60) and the 23.6% Fibonacci retracement level ($0.70) are key target levels.

