Ethereum is trading at $238, but can bulls take $246 to push bears out of the way?
Ethereum has failed to break above a key resistance level that has capped numerous upsides over the past several weeks. Ethereum has been confined between $230 and $245, the flatlining unsurprisingly similar to that of Bitcoin’s tight range above $9,000.
Analysts are however pointing to a breakout at a key level as the point at which wobbling bears get smashed off the charts.
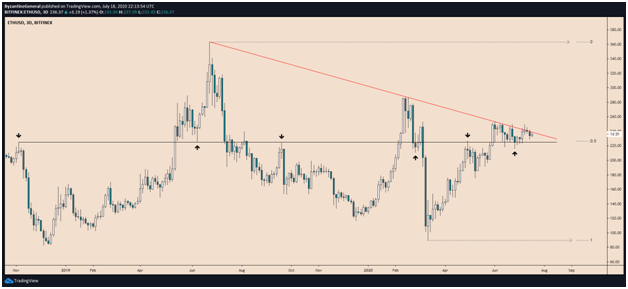
This trading idea shared by one analyst shows that ETH/USD is currently poised near the top of a range that has constrained bulls since the June 2019 highs. It is also the line that has seen bulls hit a wall in both February and June of this year.
According to the crypto trader, a break above that trendline would see bulls take control and sear through bear resistance.

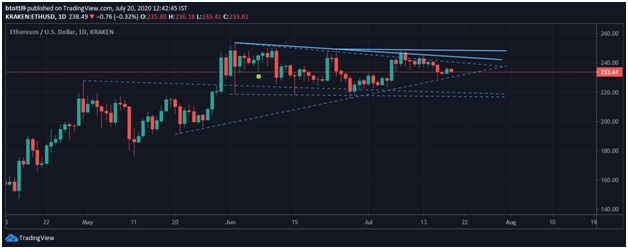
The same view is held by another trader who shared the chart below. Although the analyst thinks the breakout may not be imminent, he postulates that a run above the current range limits would be good for Ethereum bulls.

ETH/USD technical outlook
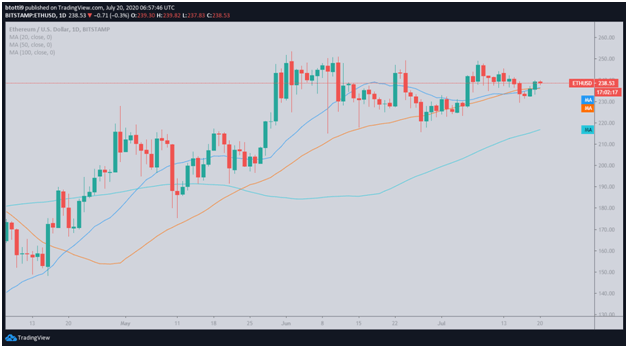
The price of Ethereum is up 2.07% on the day as of writing, with bulls looking to strengthen after a technical correction over the weekend. ETH/USD dropped to lows of $233 on Sunday, but the price is currently looking to consolidate above the 20-day and the 50-day moving averages on the daily timeframe.
Major resistance remains at $240 and $245. Above that, the next major hurdle is at $255, which marks the multi-month highs seen on June 5th.

Network growth supports ETH/USD breakout
Ethereum’s on-chain indicators are also supportive of the impending uptrend. Increased number of non-zero addresses, open interest in Ethereum futures, and increased demand for DeFi tokens are all sending positive signals for the second-largest cryptocurrency by market cap.
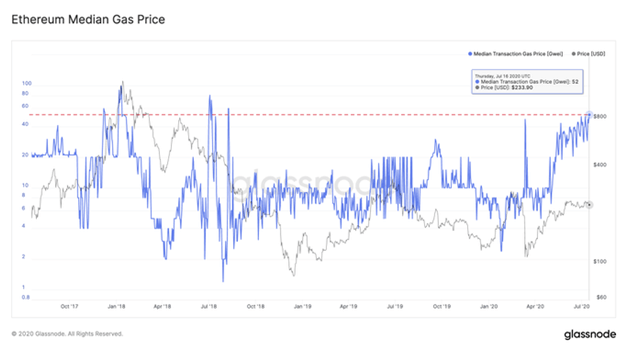
Ethereum transaction activity has soared over the past several months, pushing the network close to levels seen in 2018. At the same time, Gas prices have spiked to record highs as shown by the data below, shared by on-chain analytics firm Glassnode.
According to the data, Ethereum’s average daily Gas price has spiked 5 times since April. The surge saw the median price surpass 50 Gwei on July 19th – the first time this had happened in nearly 2 years.

Last week, Coinjournal highlighted the failure by bears to convincingly break below $238. As per the technical outlook, Ethereum needs to break above $246 to take on new momentum and aim for higher gains.

