Ethereum (ETH) bulls are looking for another rally above $2k as bears seem focused on a retest of the critical support level
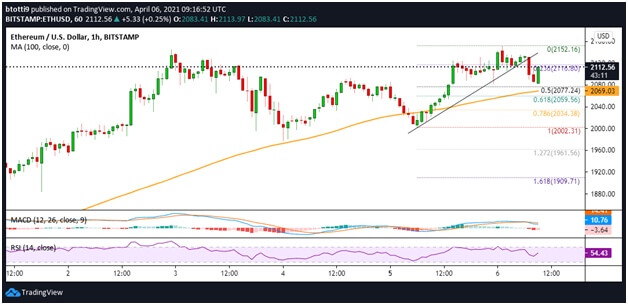
Ethereum price is trading just above $2,100 as bulls look to strengthen their grip above $2k. The ETH/USD pair has seen huge selling pressure over the past hour, with prices dipping from highs of $2,131 to lows of $2,090. Bears appear much more intent on pushing prices lower after rejecting bulls’ advances at the all-time high of $2,152.
The positive sentiment seen over the past week needs to remain intact in the short term for ETH/USD to seek fresh gains.
For ETH, this might mean copying the action seen with a few major altcoins that have continued to increase.
Ripple‘s XRP is the biggest gainer among the top ten with 36% in the past 24 hours. The XRP/USD pair is now eyeing a breakout above $1.00, a major achievement for a coin that has struggled for most of the bull market.
Other top gainers are Binance Coin (BNB) with 12%, currently trading near $385, while Litecoin is looking to break above $225 after surging 10%. Stellar (XLM) has soared 16% and trades near $0.54.
Ethereum price analysis
The technical picture for ETH/USD suggests bulls are trying to send prices higher as sell-off pressure decreases. Looking at the hourly chart, the MACD is perched above the signal line and is suggesting a weakness among the bears. The hourly RSI has also flipped above the 50 level to hand buyers the upper hand.
The cryptocurrency is currently trading just below a key bullish trend line and the 23.6% Fibonacci retracement level ($2,116) on the hourly chart. If bulls bounce higher and retest the resistance at the recent peak of $2,152, legitimate targets north of the supply barrier would be $2,200 and $2,250.

On the contrary, sentiment could turn negative if prices break lower. The initial support zone is at the key horizontal line near $2,080. If prices break below this level, we could see bears attack the 50% Fib level ($2,077) and then 100 SMA ($2,069). Further losses could aid bearish push for a retest of the $2,000 support zone

