Ethereum has sank to $234, following on from Bitcoin’s decline to $9,150
Ethereum continues to trade under $240, with the price of the second largest cryptocurrency moving in tandem with Bitcoin. Although the two coins are likely to continue their correlation, there’s a confluence of indicators that suggests an upswing for Ethereum is on the cards.
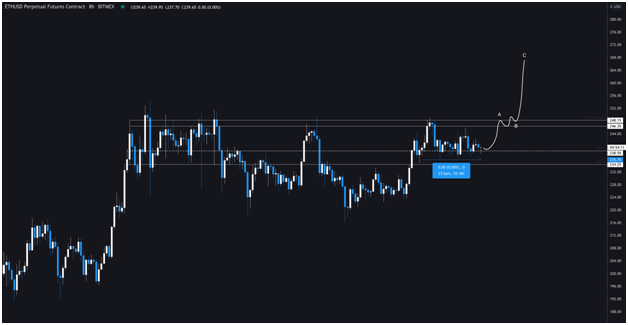
According to one analyst on Twitter, bears have failed to take charge of momentum below $238. This lack of conviction means Ethereum could be in a mini accumulation phase that is likely to precede another upswing.
Buyers will need to hold current prices, as shown on the lower time frames. An upward move to break resistance at $246 would see momentum take prices higher.

Ethereum technical outlook
Ethereum for the past seven days has traded sideways; on the cusp of a breakout helped by the lack of conviction by bears.
Although Ethereum faces the risk of a downturn if sellers come out in force, the technical outlook suggests that stalling below $240 might actually help the bulls consulate before moving to higher prices.
Bulls will need to beat bears at $239.52, which has offered the strongest resistance in the past week. It is at this level that multiple technical indicators have confluence: the Bollinger Bands widths one-hour, the shorter-term five-day simple moving average on the four hour chart. Also visible is the Fibonacci 38.2% retracement on the daily timeframe.
A rejection of the upside has healthy support at the 50-day SMA. The MACD is also hugging the midline although the RSI has turned slightly bearish.
As of writing, the price of Ethereum is exchanging hands at $235, down about 2% today so far. In the past 24 hours, ETH/USD has touched a high of $242, so if buyers refuse to give away $238, then an uptick in the market could pave the way for a retest of resistance.
Investors will be watching where the close is on the daily candle, with a break to the upper range of $200 signaling a potential downward drift.

