LTC is facing pressure near $190 as bears look to extend the breakdown below the 20-day exponential moving average
Litecoin price continues to trade near $190 as bulls target a breakout towards $200 and a possible rally to another multi-year high. The cryptocurrency looked to have picked an uptrend on 28 and 29 March, but buyers could not sustain the momentum above $200 as profit booking kicked in.
While it looks like bears have plans heading into April, Litecoin’s price could benefit from the overall optimism in the market. This outlook could strengthen if Bitcoin price manages to retest $60k and rally higher.
The market is also likely to react positively to PayPal’s announcement that its US customers can now pay with Bitcoin (BTC), Ethereum (ETH), Litecoin (LTC), and Bitcoin Cash (BCH) at any of the merchants that accept cryptocurrency.
If the optimistic view holds and LTC/USD breaks above the psychological $200 level, a fresh surge in the next few weeks could see bulls target a new peak.
As of writing, bulls face a battle to keep prices above $190, with the cryptocurrency down 1.2% and 2.3% on the day and over the week, respectively.
Litecoin price market outlook
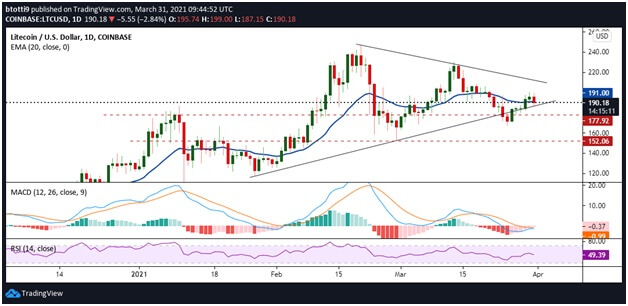
Litecoin has traded within a symmetrical triangle since breaking lower from highs of $247 on 20 February. Bears managed to send prices below the lower trend line on 28 March, with a swift reaction from bulls blindsiding bears as prices rebounded off lows of $171 to reach intraday highs of $200 on 30 March.
Today, LTC/USD came close to breaching the psychological resistance once again, touching intraday highs of $199.
If bulls push higher and successfully settle above $200, a new leg up could see them target $208. A bullish flip from this resistance line will highlight a potential run to $247 and then multi-year highs above $250.

On the downside, further losses loom if bulls fail to recover and keep prices above the 20-day exponential moving average ($191).
While the MACD suggests a hidden bullish divergence, it remains within the negative zone. The daily RSI is also below 50 to suggest bears still hold the upper hand. This could jeopardise bulls’ recovery efforts, with immediate declines likely to pull LTC/USD towards $177. The next support zone could be at $152.

