-
LTC has been in a strong bullish trend since June last year.
-
Its correlation with Bitcoin has moved from negative to 0.88.
Litecoin price has had a remarkable bull run in the past few months. Starting from June last year, Litecoin has jumped by more than 90% while BTC has risen by just 1%. The spread between the prices of the two popular proof-of-work coins has continued widening. It rose to a high of $93 this month, the highest point since jyMay 9. It has soared by more than 100% from the lowest point in 2022.
Bitcoin and Litecoin correlation
It is not clear why Litecoin and Bitcoin’s correlation has divorced in the past few months. In the past, the two, together with Bitcoin Cash, had one of the closest correlations. This means that they all tracked each other.
According to Into the Block, the correlation between the two dropped from 0.92 to a low of -0.17 on November 7. Recently, however, it seems that this correlation figure is getting close since it stands at 0.88. A correlation coefficient near of 1 is usually a sign that the two assets are moving in the same direction.
A likely reason for Litecoin price outperformance is that on-chain numbers have been relatively strong in the past few months. Mining activity, in particular, has been quite strong, with the hash rate surging to its highest level on record. Hash rate is an important number that measures the health of a network. A higher figure is a sign that activity is doing well.
Another on-chain metric is that its historical volatility has been slumping in the past few days. It peaked at 106% in November and then plunged to the current 42.6%. In fact, a closer look at the chart shows that this volatility slump started as the coin started gaining momentum. A lower volatility figure is usually a bullish signal for an asset.
Litecoin price prediction

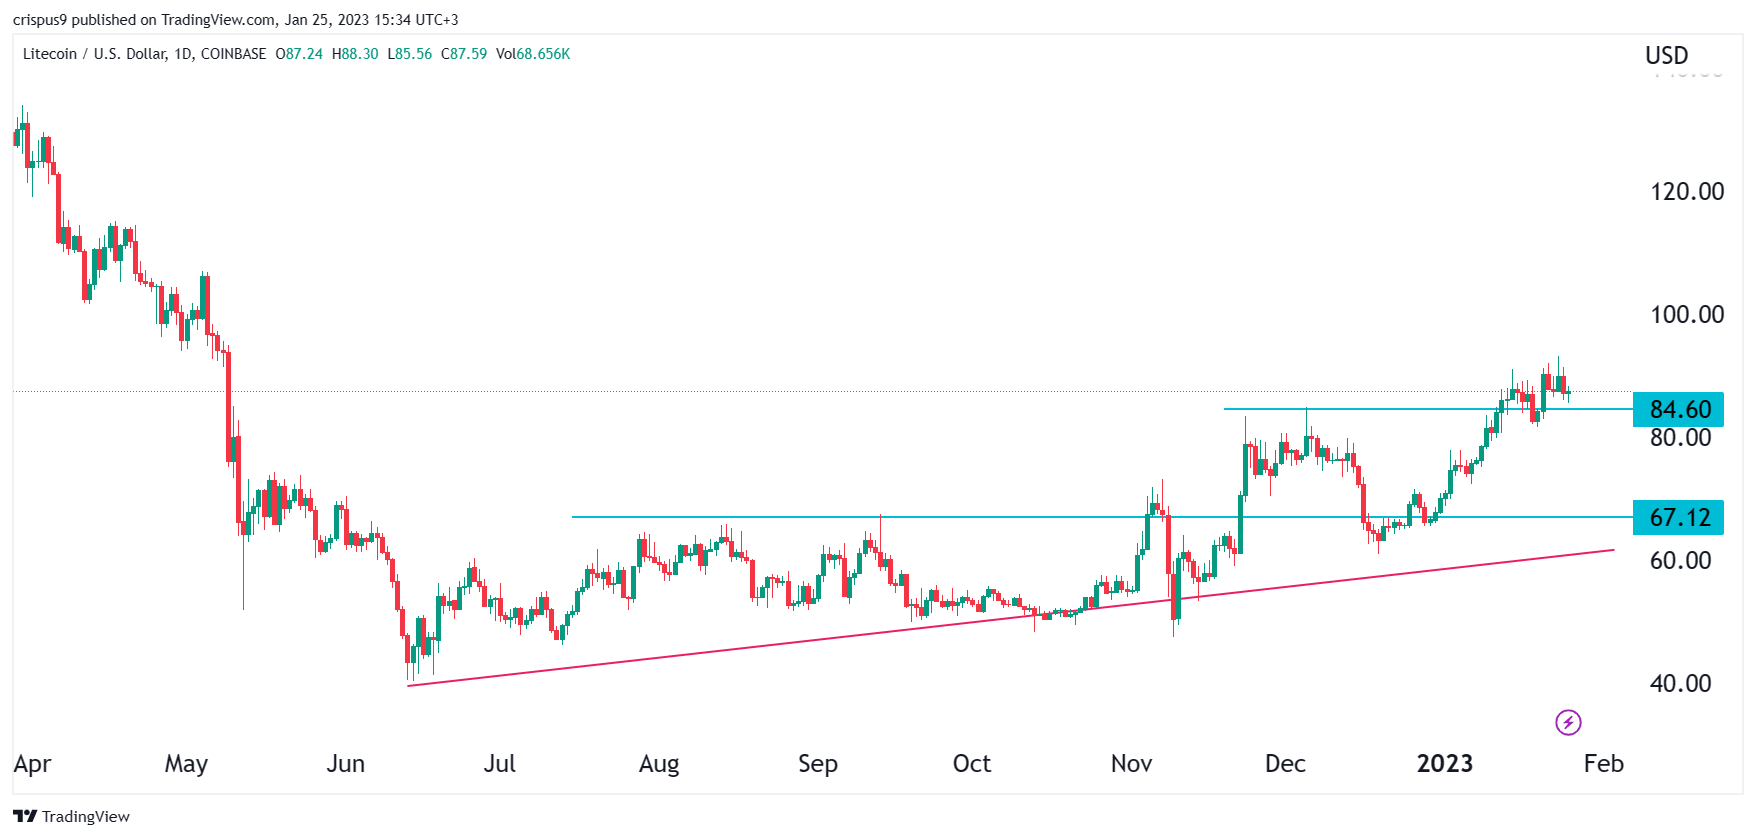
The daily chart reveals that the LTC price has been in a strong bullish trend in the past few months. As it rose, the coin formed an ascending triangle pattern whose upper side was at $67.12. It managed to cruise above that level in November, December, and January. The coin has also moved above the 25-day and 50-day moving averages.
A closer look shows that it has also retested the support at $84.60, which was the highest point on December 6. Therefore, the coin will likely have a bullish breakout as buyers target the key level at $100, as we wrote here.

