


XMR/USD is up 23% compared to BTC/USD’s -6% since September 1.
A number of crypto assets are posting huge gains, even as momentum amongst most top coins remains sluggish. On October 1st, coins like Zcash (ZEC) +12.9%, Algorand (ALGO) + 10.5%; DigiByte (DGB) +19%, and Monero (XMR) +14% are registering upside while Bitcoin, Ethereum, and XRP continue to be capped below key price levels.
Monero has greatly shown signs of decoupling from Bitcoin’s price movement, with the altcoin’s price up roughly 23% since September 1st. BTC/USD on the other hand has dropped nearly 6% from its highs over the past month.
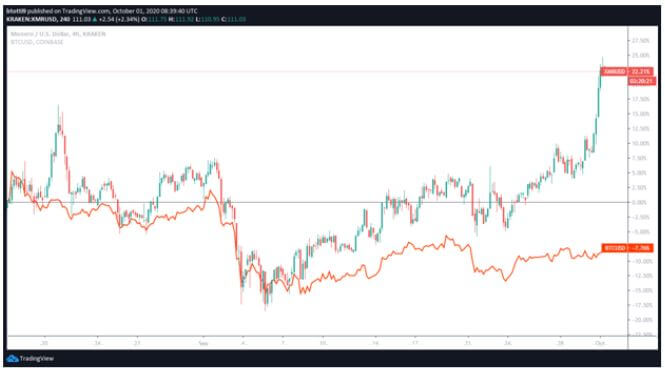
XMR/USD and BTC/USD price movement chart over the past 30 days. Source: TradingView
XMR/USD price
Monero is building up a nice bullish outlook that has seen its price jump 28%over the past week.
The sell-off witnessed across the entire crypto market the past two weeks saw most cryptocurrencies plunge alongside Bitcoin. However, XMR/USD has appeared to strongly decouple from the leading asset.
According to on-chain data platform Santiment, “Monero has been one of the more dormant large-cap altcoins in 2020.”
Nonetheless, its latest upsurge looks likely to correlate with the rise in development activity the analytics firm has been tracking. Per the firm, Monero’s development activity recently hit a two-year high.
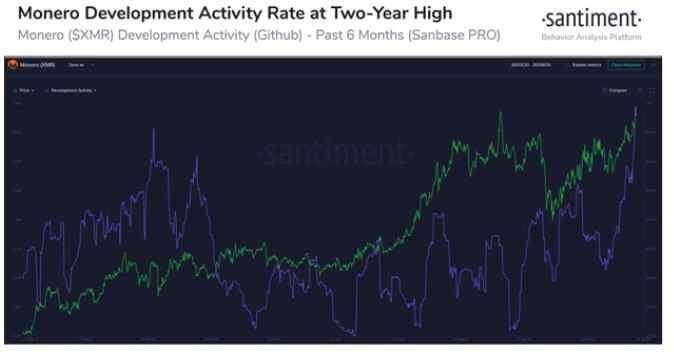
Monero activity chart. Source: Santiment
Since breaking above the ascending channel, the pair has traded higher and is on course to register a new year-to-date high above intraday highs at $113. As of press time, the XMR/USD is trading around $111.8 on major exchanges, its highest price level since June 2019 when it traded around $120.
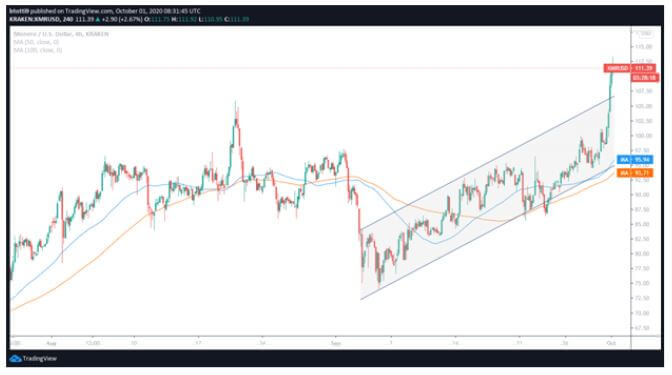
Monero price 4-hour chart. Source: TradingView
On the downside, Monero has healthy support at the 50 and 100 SMA on the 4-hour chart at $95.95 and $93.71.
BTC/USD price forecast
Bitcoin printed a monthly close above $10,700 to post its second best quarterly close since Q4 2017. It’s also only the third time in history that BTC/USD has traded above $10k at quarterly close- the other being Q2 2019 when it closed around $10,569.
As of writing, Bitcoin is trading around $10,830 and has extended its record in a number of days above $10,000. If bulls rally above prevailing price levels, a weekly close above the previous candle could see a break above $11,000 bring into play plans for a shot at $12k.
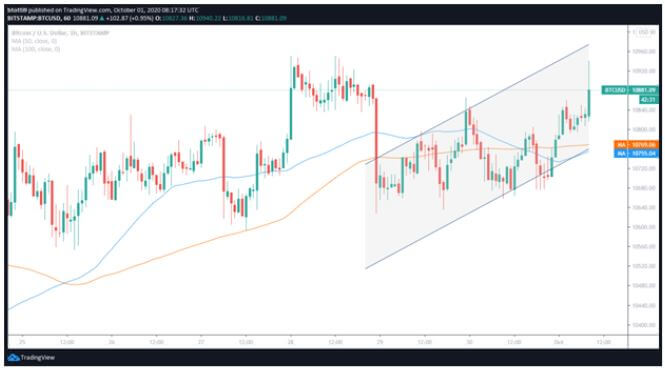
BTC/USD price hourly chart. Source: TradingView
The hourly chart features an upturned RSI above the midline to suggest bulls are building an upside momentum. Bulls should target a candle above the 50 SMA to keep the pace, likely to retest the $11,500-$11,800 resistance area. Meanwhile, given the range seen over the past few days, a rejection at higher levels should see any selling pressure whittled around the $10,700-$10,600 area.