Monero, Stellar and Aave are among the top altcoins looking to rally higher after weekend gains
Monero and Stellar could see their prices spike to new highs this week as Bitcoin’s (BTC) potential breakout above $20,000 warms up crypto market sentiment. If the leading cryptocurrency cracks the $20k barrier, its upside into price discovery could prove pivotal for altcoins.
Apart from the major altcoins, other tokens likely to see a huge move this week are those in the decentralised finance (DeFi) space. AAVE could rise to $100 if bullish momentum sweeps the crypto market.
XMR/USD
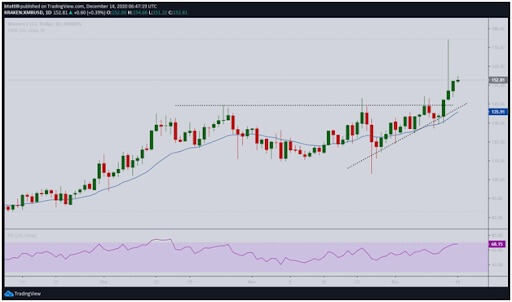
Monero has gained over 5% in the past 24 hours to see its price stabilise above $250. Despite the dip to the 20-EMA this past week, bulls have maintained their advantage via aggressive buying.
 XMR/USD daily chart. Source: TradingView
The RSI is ticking above 68 to suggest bulls retain the upper hand. If upward pressure takes prices to $160, the next target will be to sustain the breakout to $180.
However, if XMR/USD hits a downturn and drops under $150, the next support level is at the 20-EMA ($135.91).
XLM/USD
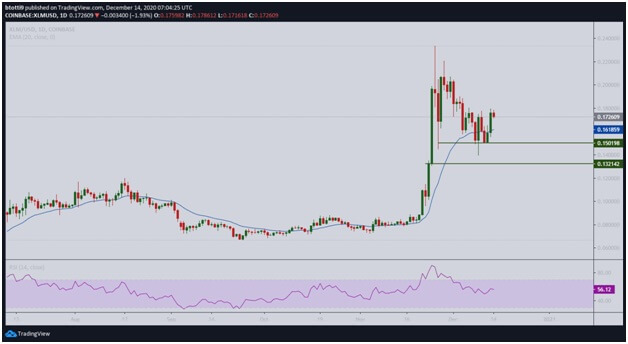
Stellar has soared more than 9% in the past 24 hours as bulls target a breakout to $0.20. After rebounding off $0.149 lows, a rally above the 20-day EMA saw XLM/USD touch highs of $0.179.
Currently, bulls are facing overhead resistance around $0.173. If they crack the barrier, Stellar’s price could rally to $0.20 short term. Above this, demand pressure could push prices to $0.24.
Conversely, the negative divergence of the RSI suggests a bearish flip to the 20-EMA ($0.161) might provide the path of least resistance.
If the bears succeed with plans to stall the upside and build downward momentum, XLM/USD could dip to $0.150 and $0.135.
 XLM/USD daily chart. Source: TradingView
AAVE/USD
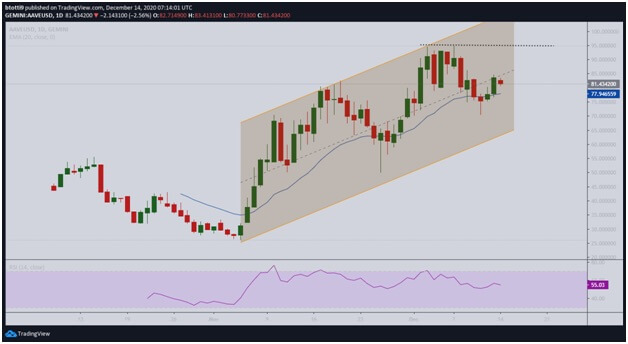
AAVE continues to trade inside an ascending parallel channel. The upper boundary of the channel provides the main resistance line around $95. If bulls break to the resistance line and sustain upward pressure, an upside to the psychological $100 will follow.
Above this, prices could retest the upper resistance line of the parallel channel at $112.
 AAVE/USD daily chart. Source: TradingView
However, as can be seen on the daily chart, sellers are adamant around the middle line of the channel. The area has capped the recent upside from lows of $70.
The RSI remains above the midpoint (currently printing 55) but is suggesting a negative continuation. If bulls don’t keep AAVE/USD above the 20-EMA ($77), the downturn might push prices to lows of $65 short term.

