If upside momentum increases, XRP/USD could test resistance at $1.28 and possibly move towards $1.42
XRP price is struggling for upside near a critical resistance level, with its value just in the green at time of writing. The XRP/USD pair is currently changing hands near $1.24, a zone that is likely to see a fresh rejection or breakout to recent highs.
A look at the market shows that the top two cryptocurrencies, Bitcoin and Ethereum, have also been facing some selling pressure after breaching $50,000 and $3,300 respectively. If the overall sentiment pushes cryptocurrencies into the red, XRP might see losses below $1.20.
However, as bulls appear to retain considerable control, a decent move in the opposite direction would invite new bids and maybe trigger a fresh rally to $1.42 or even $1.66.
XRP price outlook
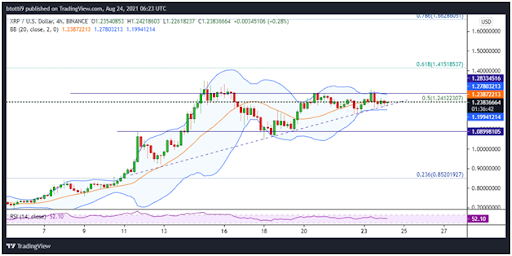
The XRP price perspective suggests a period of relative quiet might allow for further consolidation in the $1.20 to $1.28 range. The Bollinger Bands indicator is narrowing to highlight decreased volatility, which sets up XRP/USD for a possible retest of the lower band as bulls struggle to breach the barrier at the middle curve.
The cryptocurrency's price on the 4-hour chart also shows XRP bulls are struggling near the 0.5 Fibonacci retracement level of the macro move from $1.97 to $0.50. The hurdle is presented at the $1.24 price level, which has added to the possibility of new downward moves.

XRP/USD 4-hour chart. Source: TradingView
Bulls can prevent another downswing if they hold XRP price above the ascending trendline of the highlighted triangle pattern. This line has kept Ripple's bullish outlook intact since the first week of August and is currently looking to do the same.
The possibility of a rebound is there given the 4-hour RSI indicator is above 50, suggesting buyers have a slight edge.
If bulls register another bounce off the trendline, consolidation above the 0.5 Fib level ($1.24) could allow bulls to breach horizontal resistance at $1.28. This move would open XRP/USD to legitimate moves towards the 0.618 Fib level ($1.42) and then the 0.786 Fib level ($1.66).
On the downside, exhaustion for the bulls might see XRP price move below the aforementioned trendline and the Bollinger bands’ support curve. The bands currently provide an anchor around $1.20, but a clear breakdown amid increased selling pressure could push XRP/USD to the horizontal support level at $1.09. Beyond this, buyers might rely on the demand zone at $0.85 — the 0.236 Fib level.

