Vechain drops 4.9%, Stellar continues its upside and Algorand shoots 21% as most coins trend red.
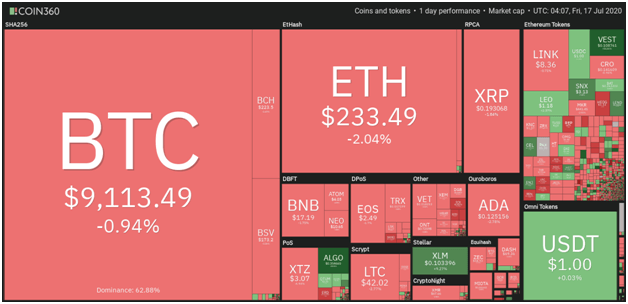
Bitcoin price has not registered any significant move above $9,100 for the past 5 days and remains sideways going into the weekend. The same picture is replicated by most of the top altcoins, although Stellar and Algorand are showing marked upsides in early trades this morning.

VET/USD
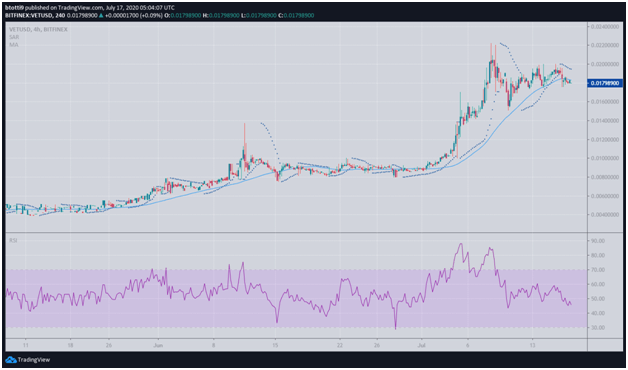
Vechain has been one of the biggest gainers in July, with the uptrend seeing bulls target a new high above $0.020. However, as the cryptocurrency market wobbles alongside Bitcoin, bulls have hit resistance at $0.0194 to put a stop to their push for $0.02.
As of writing, VET/USD is trading at $0.0183 and has declined about 4.9% in the past 24 hours.
Although VeChain might yet correct higher during the US and European trading sessions, bearish pressure may see it test support at $0.01760.

The Parabolic SAR is above the price bars to suggest a downward trend is likely and VET/USD is trading below the 50-day MA.
Both the MACD and the Relative Strength Index (RSI) suggest sellers have an appetite, with a bearish divergence formed on the 4-hour chart. The RSI has slipped under the midline and bulls need it to tick above 45 for them to retain an upper hand at the $0.018 area.
XLM/USD
Stellar is one of the top altcoins currently trading in the green with more than 9% gains in the past 24 hours.

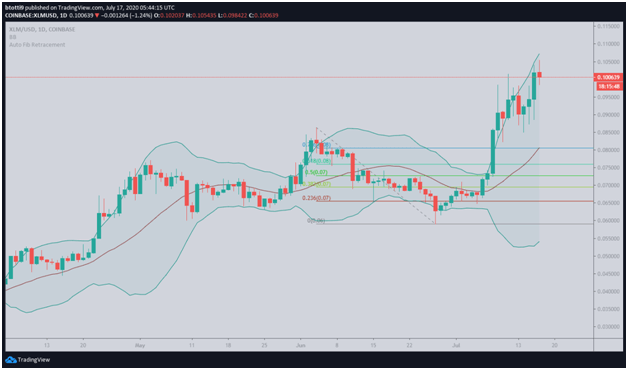
The XLM/USD technical picture on the daily chart shows that price is trending overbought as suggested by the RSI. Bulls are looking for a green candle close on four out of five days this week, with prices currently trading at $0.10106.
XLM/USD has touched a high of $0.103 and could go higher if bulls maintain the advantage.
Price has moved away from the upper curve of the 20-day Bollinger Band. However, any downside has support at $0.094 and the 78.6% Fibonacci retracement level at $0.080 which is also the midline of the Bollinger Bands on the daily chart.
ALGO/USD
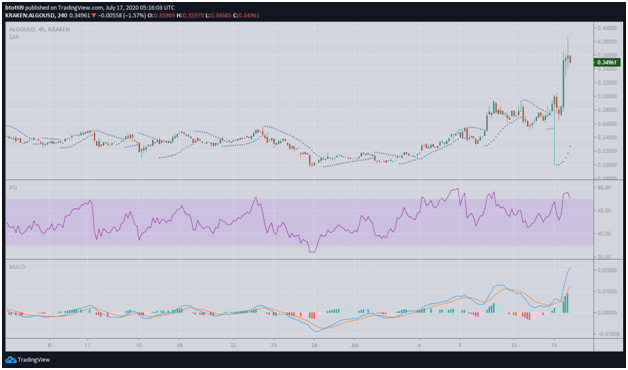
Algorand has spiked more than 21% in the past 24 hours to hit a new multi-month high of $0.38. The cryptocurrency has gained over 50% in the last seven days and currently looks set to rise.
Momentum has been helped by Coinbase listing the token on its main trading platform. The US-based cryptocurrency exchange is also set to roll out trading pairs for EUR and GBP.
As of writing, Algorand is trading at $0.355 against the US dollar; with major resistance expected at $0.39 while bulls can rely on support at $0.3215 in case of a downward flip.

A look at the charts shows the Parabolic SAR cutting below the price to suggest that a bullish bias continues. The MACD also indicates the upside will continue, but traders might have to consider the RSI that is currently trending overbought.

