Bitcoin (BTC) whales have seemingly stopped another push towards the upside, enhancing the resistance near the 20k area
While Bitcoin’s outlook is quite bullish, the reported 6.2% decline in the number of Bitcoin whale addresses shows some institutional (or large holder) hesitation. When taking a look at its week-over-week performance, BTC has posted a 6.51% gain and slightly outperformed ETH’s 6.04% gain. On the other hand, XRP ended up in the red as it lost a whopping 12.81% in the same period.
At the time of writing, BTC is trading for $19,150, being 0.01% in the red when compared to its previous month’s value.
Technical Analysis of BTC/USD
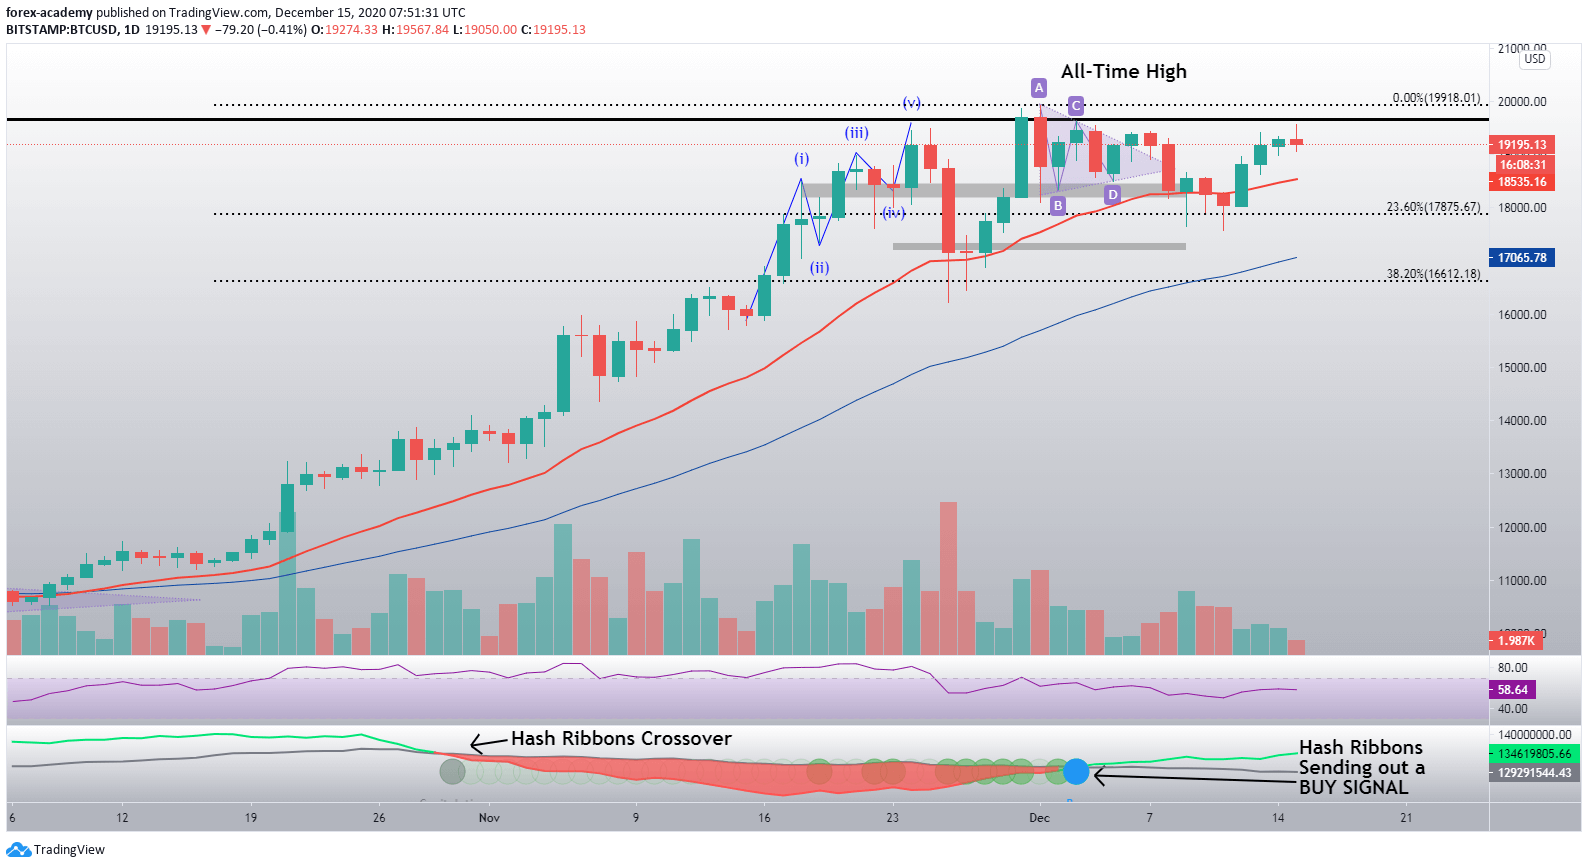
Bitcoin has been quite volatile for the past 24 hours despite price remaining almost the same since yesterday. Bitcoin attempted a push towards $19,666 resistance, but got stopped out quickly, prompting a swift retreat towards the $19,100 level. The leading digital asset is currently trading at between $19,100 and $19,200.
If the strong profit-taking presence coming from Bitcoin whales remains, we may expect a price dip to the next daily Fib retracement level, sitting at $17,875. However, in case bulls prevail, we may expect another strong attempt towards $20,000, which could possibly spell new all-time highs.
 BTC/USD daily price chart. Source: TradingView
The technical overview shows that the RSI indicator remains flat on the daily chart, as it sits just below the 60 mark. Investors might be more interested in the Hash Ribbons indicator, which posted a buy signal on 3 December, as well as in the bearish sign seen in the number of whale addresses dropping by 6.2% over a short period.
As mentioned above, Bitcoin’s current bullish sentiment will be tested by the heavy resistance sitting around the $20k mark. If the bulls prevail and Bitcoin surpasses $20,000, we may expect its next resistance level to be around $20,750.
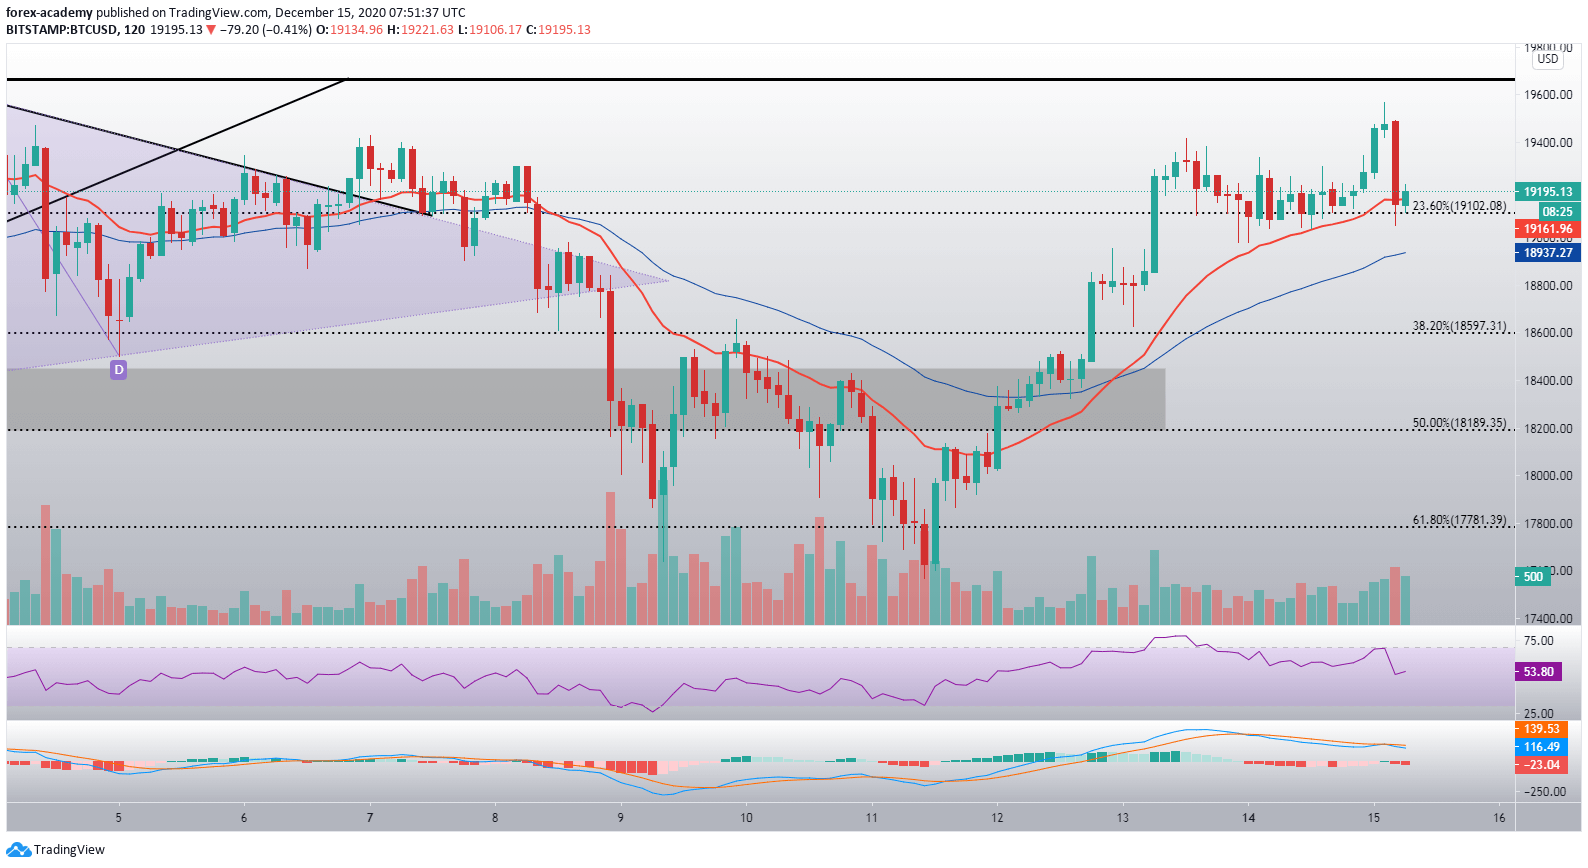
 BTC/USD 2-hour chart. Source: TradingView
When taking a look at the 2-hour time-frame, we can see some of Bitcoin’s failed pushes towards all-time highs, which have been getting stopped out at $19,600. The move was accompanied with average volume, which was a strong indicator of the move failing, even before that happened. The sharp decline in price that happened right after hitting the wall at $19,600 brought BTC to $19,100, which is where it is consolidating at the moment.
Bitcoin’s immediate upside is guarded by the 2017 high of $19,666, which also presents the bottom line of the high-resistance zone that extends to the psychological level of $20,000.

