Ripple (XRP) experienced a price reversal and headed upwards as Bitcoin’s push towards its new all-time high of $22k pulled the market up
The fourth-largest cryptocurrency by market cap had an amazing day, as it ended up being one of the top performers in the cryptocurrency sector. The bull rally started by Bitcoin reaching its all-time high pushed XRP up as well, making it reach as high as $0.585 before stepping back to consolidate.
While we noted that yesterday’s look for XRP was bearish, today’s outlook seems completely different. When taking a look at its week-over-week performance, XRP managed to rebound from being in the red, posting a gain of 10.75%. However, despite its amazing performance on the day, BTC and ETH still outperform its weekly gains, as they managed to go up 17.82% and 13.35%, respectively.
At the time of writing, XRP is trading for $0.558, being 4.24 % in the green when compared to its previous month’s value.
XRP/USD
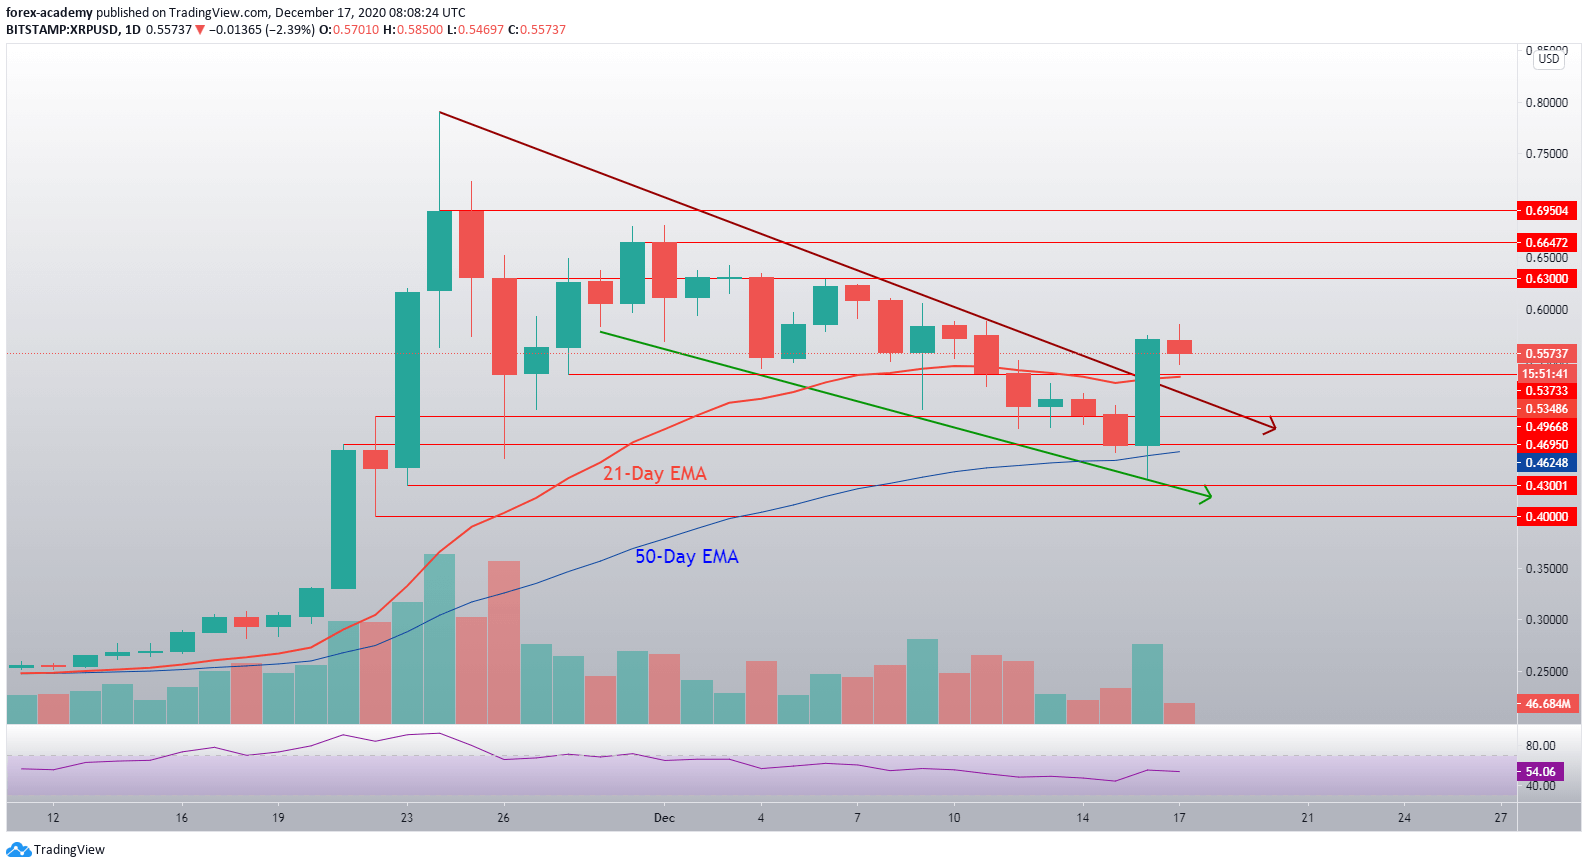
XRP has broken its descending channel it was trading in ever since 1 December. The sudden uptick was caused by Bitcoin’s push towards the upside as it entered discovery mode after breaking the $20K all-time high. As can be seen on the daily chart, not only has XRP posted a candle that broke the descending channel, but it is doing great (so far) in confirming it as well. The downside is additionally guarded by the 0.537 level.
XRP’s outlook can change to completely bullish if XRP ends up finishing the day above its immediate support level. In that case, the fourth-largest cryptocurrency by market cap will most likely start moving towards the upside.
 XRP/USD daily price chart. Source: TradingView
The technical overview shows that XRP’s RSI indicator on the daily time-frame had a slight uptick, but is mostly stable near the middle of the range. The volume seems to be on a slight increase, after steadily descending ever since late November.
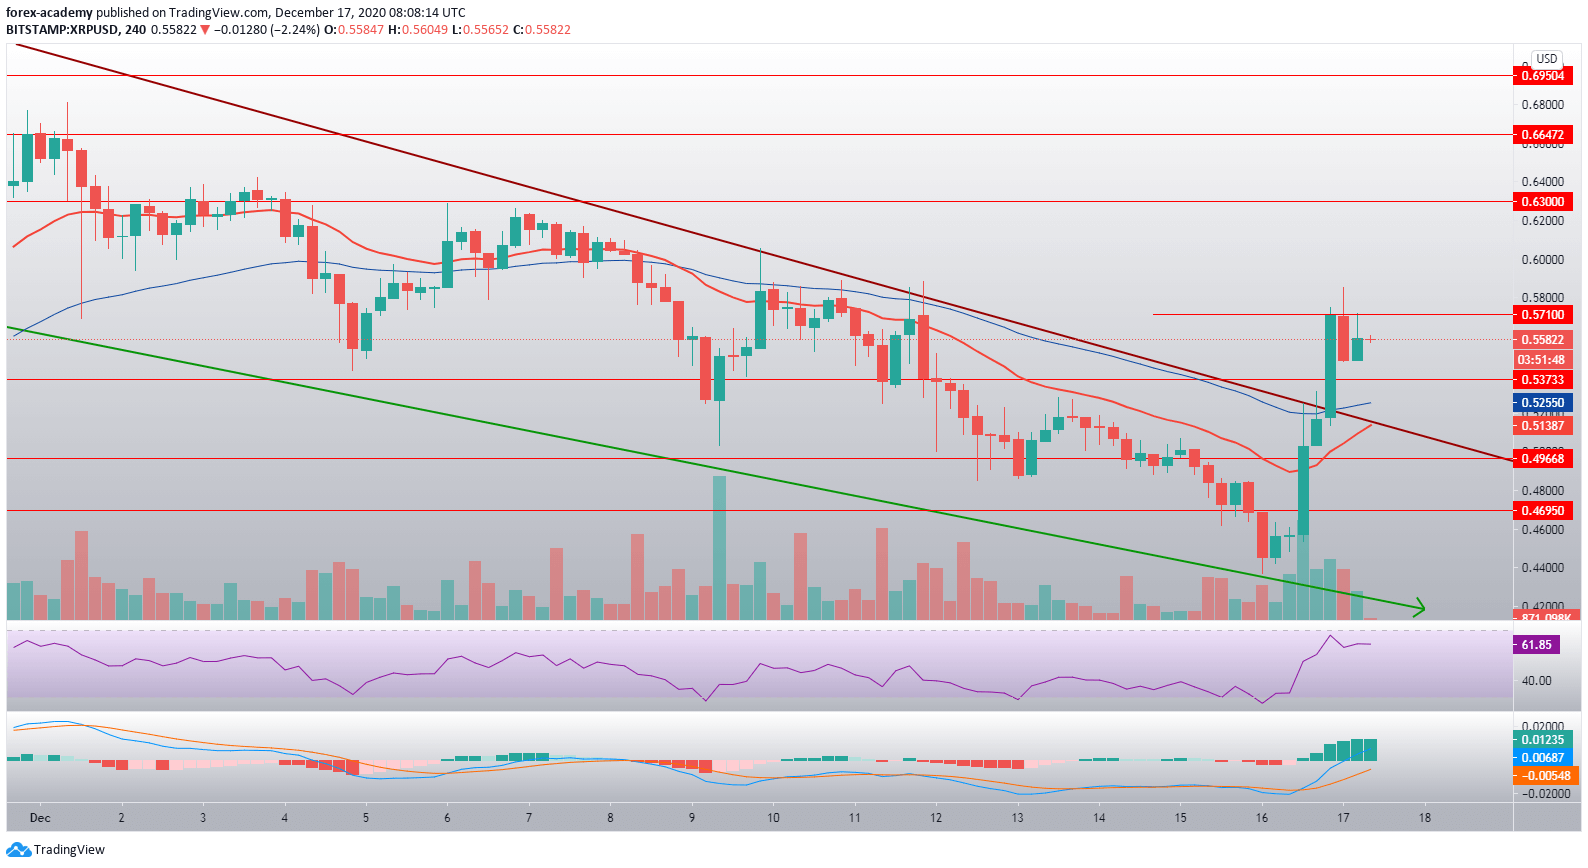
XRP’s uptick got stopped out near $0.57, which threatens to become an extremely strong resistance level. However, if XRP bulls step up slightly more, we can see the $0.63 level being contested.
 XRP/USD 4-hour chart. Source: TradingView
When taking a look at the 4-hour time-frame, we can see exactly how XRP managed to bounce off of the bottom (green) descending channel line, and then propel itself above the channel altogether. It is now trading between the $0.537 support level and $0.57 resistance level on relatively high volume.

