Ripple (XRP) jumps more than 6% to break above $0.255 but is weak below a critical resistance line
XRP price is up 6.5% in the past 24 hours as major altcoins look to bounce after a dismal performance over the past two weeks.
But XRP’s price is still below a long-term descending triangle pattern and bulls need to move above the resistance line to seize control. If price dips from the current levels, we go back to the grim outlook despite Ripple’s Q3 Markets report that paints a positive picture for the token.
According to the company, the last three months saw the daily volume jump from an average of $196.28 million to $403.58 million as reported during the previous quarter. As per this data, it appears XRP daily volume jumped nearly 200% over Q3, 2020.
But despite the massive uptake as shown by the reported volume, XRP price continued to underperform other top tokens over the past month.
At the time of writing, the cryptocurrency is trading around $0.251. Although it’s gained by more than 6% in the past 24 hours, the token is just 2% up against the US dollar in the past 30 days.
In comparison, Bitcoin is +44% in that time, with Ethereum and Litecoin surging 27% and 21% respectively.
XRP/USD price outlook

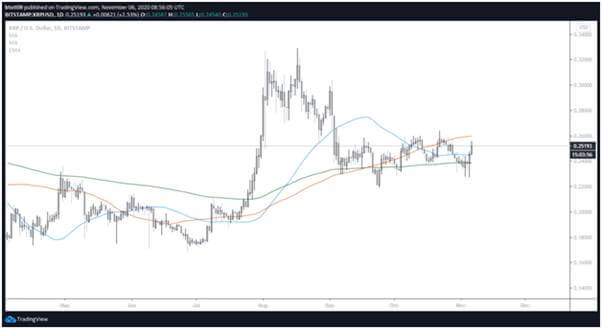
Ripple’s XRP bounced off support at $0.245 to climb to highs of $0.255, with the action likely to aid bulls’ desire for a breakout to September highs around $0.304.
However, despite the upside seen over the past 24 hours, XRP remains capped under a descending triangle pattern. Although XRP price is above the 100 hourly moving average and looks set for a move higher, the picture remains delicate if bulls fail to hold onto recent gains.
The price is also above the 50-SMA and 100-SMA on the 4-hour charts, and the 200 exponential moving average (EMA) that acted as resistance on the upside from lows of $0.22 offers support at $0.239.
The target for bulls is to cross above the 100-SMA on the daily chart and the upper boundary of the triangle, which are likely to prove stubborn near $0.26.
If XRP does not sell-off massively in the wake of Bitcoin’s rally to $16,000, a bullish breakout to the desired $0.30 area could form if altcoins begin to rally while Bitcoin hits an expected consolidation phase before attempting a run to a new all-time high.
The Relative Strength Index and the MACD on the daily chart suggest bulls are taking the upper hand, but a clear picture can only emerge if price breaks above the aforementioned barriers.
On the flip side, another rejection around the $0.26 area could see XRP decline to the 50-SMA and 200-EMA support levels. If sell-side pressure mounts, the price could drop to $0.22, an area where we find the 200-SMA.

