Bitcoin’s (BTC) price plummet overnight pulled the whole crypto sector down with it, causing a $100 billion overall market cap loss
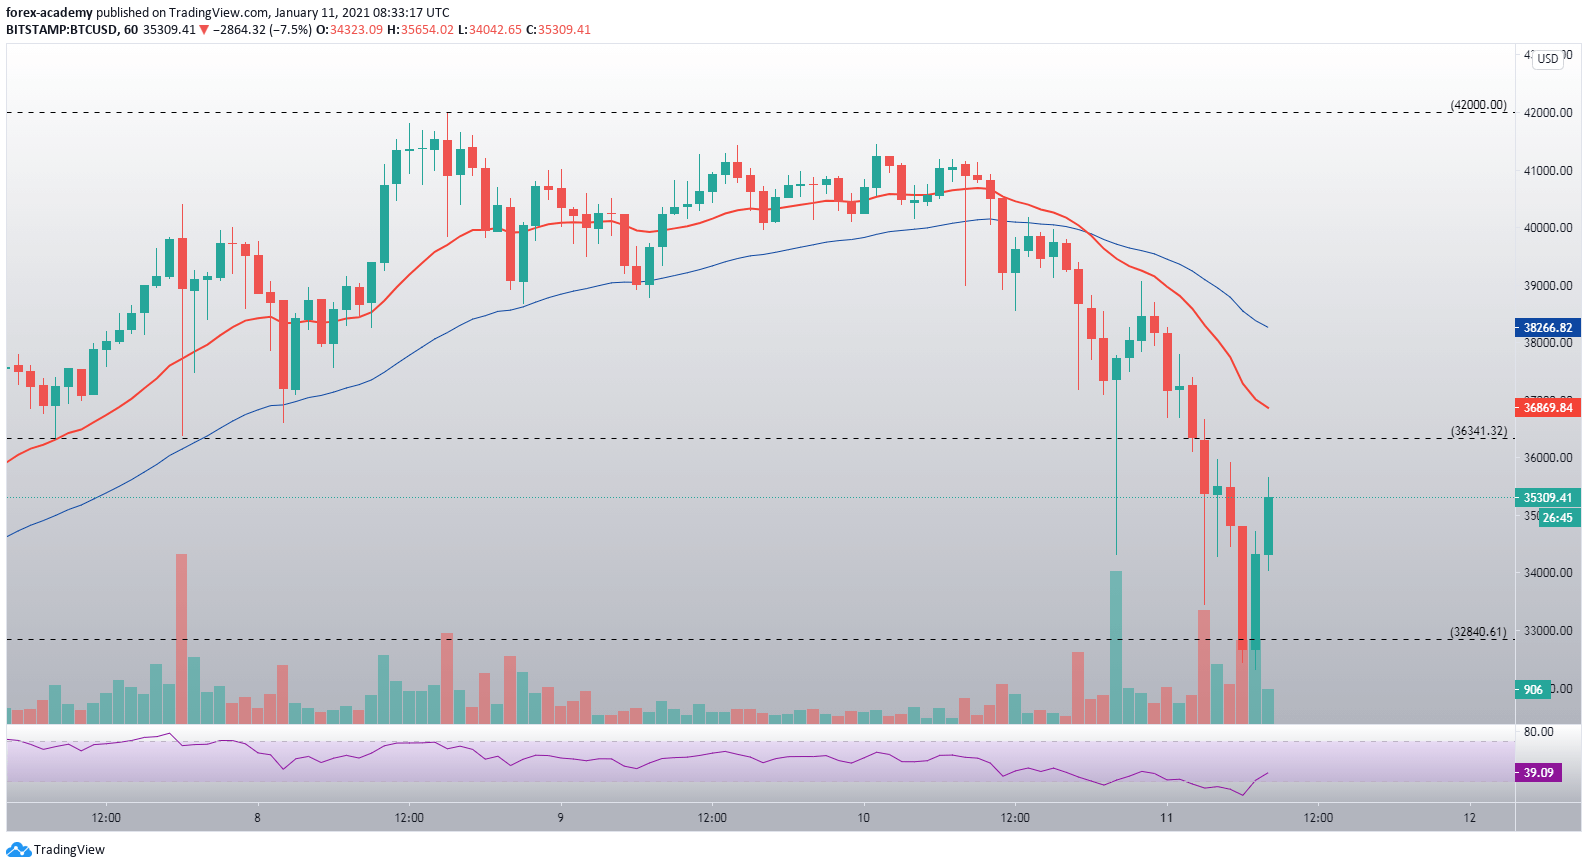
In the lead up to the correction, Bitcoin failed to break $42,000 multiple times, after which it slowly pulled back below its hourly time frame averages. However, the slow pullback turned into a crash that brought its price to as low as $32,330, pulling the whole market down alongside it as long position liquidations started kicking in.
This now means that Bitcoin’s overall outlook is much less bullish than it was 12 hours ago. The supply squeeze that pushed its price up couldn’t keep up with the market’s demand to retrace, which in turn caused this crash. Bitcoin scored a weekly loss of 7.19%, while Ethereum lost 11.81%.
At the time of writing, BTC is trading for $35,400, which represents a price increase of 55.86% when compared to the previous month’s value.
BTC/USD
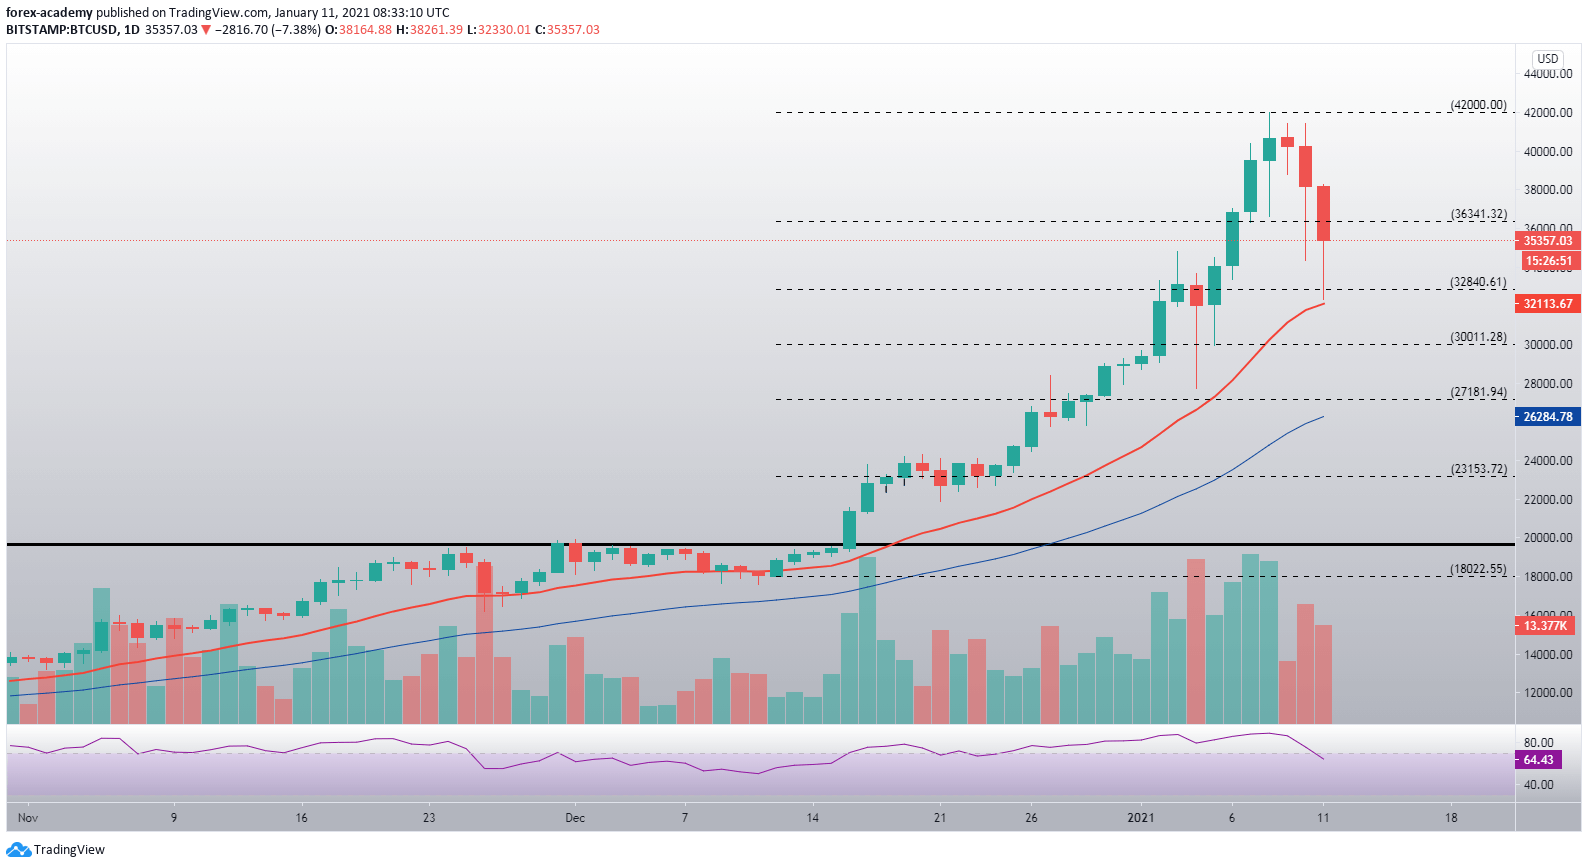
The daily chart saw a third red candle in a row, this time crashing to lows of $32,330 before buy orders stepped in to halt the selloff.
Bitcoin’s price bounced nicely off of the 21-day moving average, and is now back up to above $35,000.
Bitcoin faces strong resistance at the $36,340 level, while its support levels are a bit vaguer. Its nearest strong support sits at $32,840.
 BTC/USD daily price chart. Source: TradingView
Bitcoin’s RSI on the daily time frame has finally left the overbought area, as it currently sits at a value of 64.43.
High trading volume did not allow it to move sideways, but forced price action decisively up or down.
 BTC/USD 1-hour chart. Source: TradingView
Bitcoin’s hourly time frame shows us how Bitcoin slowly dropped below the 21-hour and 50-hour moving averages, failed to come back up, and then crashed down as the two EMA’s made a crossover. Many long positions got liquidated in this sharp move, ultimately causing BTC to descend even quicker and lower.
The downturn was picked up by the bulls near the $32,840 level, and Bitcoin has been slowly making gains ever since.

