Cryptocurrencies have returned to the spotlight this week after the price of Bitcoin soared above $10,000, reaching its highs for almost 1 year. This rise has positively impacted the industry, sparking the interest of the bulls with various headlines that ensure that the technical profile of many cryptocurrencies denotes a break that could lead to a sustainable bullish scenario. Discover our technical analysis of the 4 cryptocurrencies with the best technical profile for this possible bullish wave.
VeChain (VET) combines a strong fundamental profile with bullish technical indicators
Fundamental analysis is one of the key factors in analysing any financial asset, and an aspect that is sometimes neglected in the crypto sphere. In the case of VeChain, this project currently presents a bullish technical profile in combination with a solid fundamental background.
This blockchain project focuses on supply chain management and provides solutions for the transparent flow of information and high-speed value transfers. This makes it a very effective alternative for implementation in real life applications, which has given it very relevant associations. Thus, large companies such as H&M, PwC, Walmart China and BMW have adopted the VET blockchain for different projects.
The following elements stand out in VET’s technical analysis:
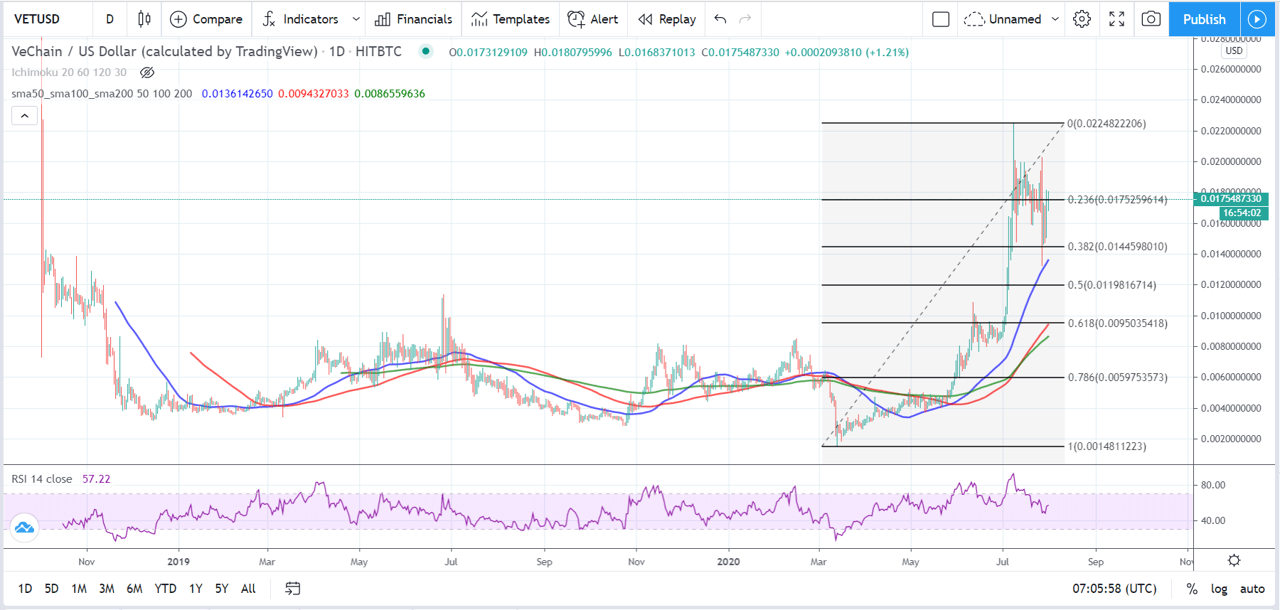
- VeChain breaks the rules and touches its all-time highs in 2020. This allows it to establish a clear area on the rise. It ranges from $0.0199 to $0.0225. The latter has been the maximum reached by VET on the HitBTC exchange in July this year.
- VeChain hit a golden cross in June, with the 50-day moving average breaking the MA200 higher.
- This bullish outlook is confirmed after a rise of more than 200%, followed by a necessary consolidation for a healthier RSI profile.
- After falling overbought, the RSI is already in the neutral zone and gives room for the bulls to break the price higher again.
- If VET fails to break the $0.017 zone higher, it may seek consolidation around $0.0158 before falling to the $0.014 support.
- Should the resistances break and continue the bullish path, VeChain would seek new all-time highs in a unique opportunity for this Chinese cryptocurrency.

IOTA: About to break a long bearish streak?
Despite having a very robust and stable structure in terms of adoption and uses in the real world, IOTA has been stagnant for a long time and – unlike other cryptocurrencies – it is far from its historical maximums.
Despite multiple business partnerships with large companies like Microsoft, Bosch, Volkswagen and Fujitsu, IOTA’s price is 95% below its all-time highs. In a bullish direction, we would be talking about a return on investment opportunity of more than 2000%, if IOTA reaches its ATH again.
But the bearish streak may end soon. Following a technical analysis, we have determined several bullish indicators and other interest levels for the bulls. Here is a summary:
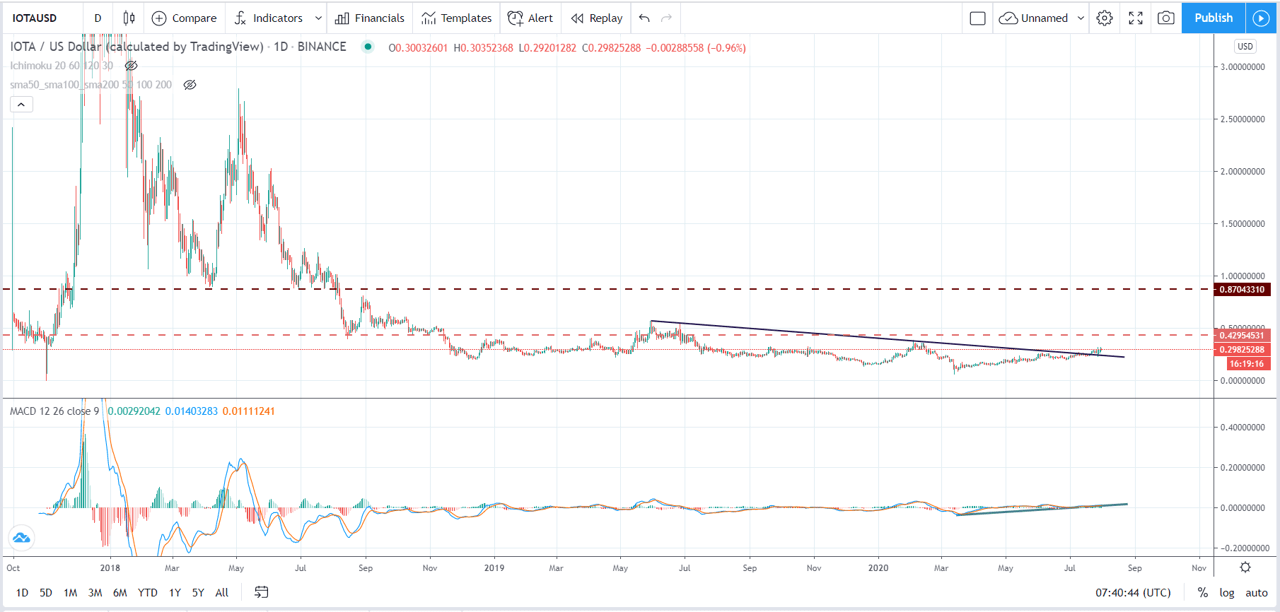
MIOTA manages to break a clear downtrend line at the highs, but will still have to confirm the break to improve the outlook.
Although it still does not show clear bullish performance on daily candles, the Moving Average Convergence / Divergence (MACD) already outlines a bullish scenario for IOTA, which is made more sustainable by the recent correction of the RSI.
However, for the outlook to be really positive, the MIOTA price would have to break 2 structural levels. The first is located near $0.43. The 2nd, even more relevant, is clearly drawn around $0.87.

LINK: Unstoppable growth
Since the beginning of the year, ChainLink has completely ignored the vicissitudes of the coronavirus to accumulate profits of more than 317%, making it one of the most profitable cryptocurrencies so far in 2020.
As we unveiled in a recent article, LINK is leading the cryptocurrency race focused on DeFi, an area of the crypto industry that is in full swing. Decentralized finance has even made a place for itself in CoinMarketCap, which now lists cryptocurrencies in this important niche.
Although the increase is already more than notable, LINK seems to continue to have good short and medium-term prospects:
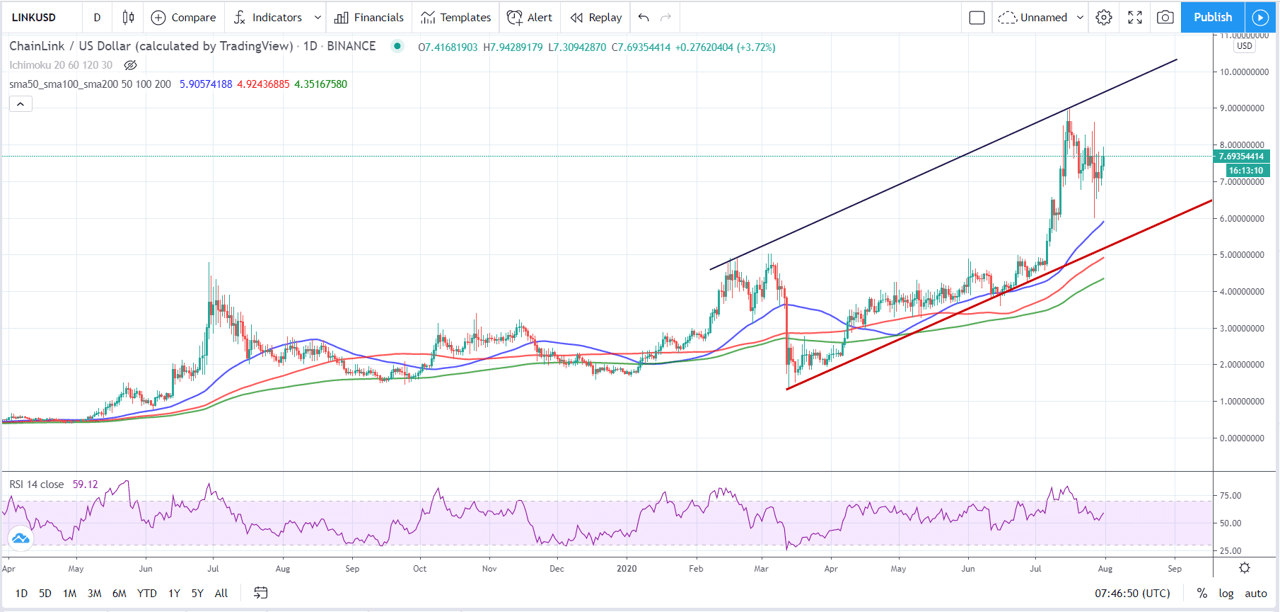
- LINK has been drawing a clear bullish channel since the beginning of the year, although quite volatile.
- The RSI is closer to the oversold zone, but the bulls continue to have oxygen for another rise.
- The first bullish target is at all-time highs, which touched $9.00 a few weeks ago. If LINK manages to beat them, the bullish trend line at the highs will serve as a reference.
- Regarding supports, chartists seem to have given great credit to the 50-day moving average, which after making a golden crossover almost 1.5 years ago, has tested crucial support in the MA200 multiple times.z

Bitcoin: Hits 6 figures according to Max Keizer
The leading cryptocurrency also sneaks onto the list, and it’s not by falling for a cliché. After overcoming a difficult technical resistance above $9,000 and a psychological resistance around $10,000, Bitcoin has once again been put on the buying list of many experts who have begun to take a bullish stance similar to that of 2017.
Thus, Wall Street veteran Max Keizer has predicted that the price of BTC will touch $28,000 before retracting again. However, it would later reach 6 figures. In his opinion, he will have to maintain support above 10K to achieve this milestone.
Let’s see what the daily technical analysis of Bitcoin tells us:
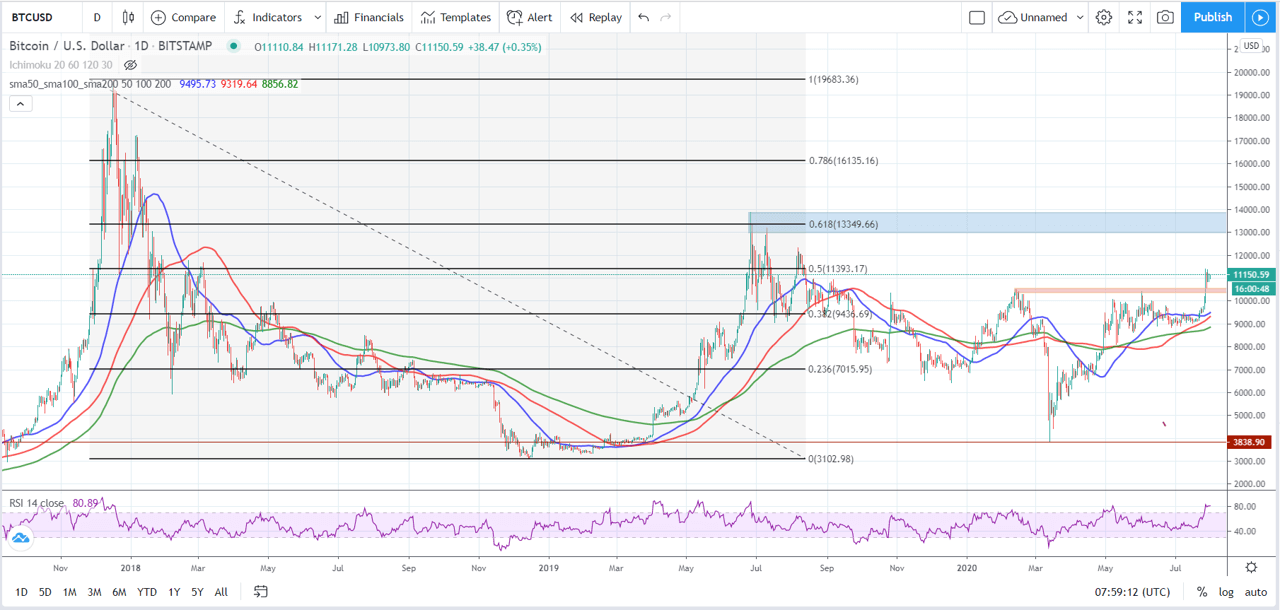
Bitcoin overcomes a very important resistance around USD 10 400 and is now located in one of the Fibonacci retracements demarcated by the great downtrend after its highs in 2017.
Although the outlook is bullish, in the short-term, Bitcoin would need a correction based on the oversold data from the relative strength index (RSI).
Thus, it is possible that it will test support again in the area mentioned in the first point of this analysis.
Then it will have to face an Achilles heel close to $13,400, a resistance that is also confirmed by the IBF retracements.
Bitcoin is another cryptocurrency to confirm a golden cross in moving averages, improving its technical outlook for the first time since the beginning of the year.


