


Ethereum (ETH) has spent the weekend consolidating and preparing for the next move after it couldn’t break the $1,300 level. Where will Ethereum go next?
The second-largest cryptocurrency by market cap spent the weekend consolidating and trading sideways after it failed to break the $1,300 mark. The sideways trading came after three days of almost continuous price rise, which started at slightly below $1,000.
Ethereum’s overall outlook is very bullish, which its current “decoupling” from Bitcoin confirms. Looking at the weekly performance, ETH has posted gains of 7.88%, outperforming BTC’s loss of 3.36%. On the other hand, XRP managed to lose 9.23% in the same period.
At the time of writing, Ether is trading for $1,220, which represents a 67.17% gain when compared to its previous month’s value.
ETH/USD
Taking a look at the daily chart, Ethereum’s price has been a bit shaky in the past days, but the cryptocurrency managed to stay above the $1,000 level and push itself back up near its all-time high levels. Ethereum is currently outperforming Bitcoin, which is in a short-term downtrend.
Due to its descending volume and relatively high RSI value, analysts predict that Ether’s price will most likely move down and retest the $1,000 level, especially if Bitcoin’s price continues moving towards the downside.
Ether will, depending on if it breaks its immediate support ($1,103) level or resistance ($1350) level, push to the downside or upside with (most likely) great force and high volume.
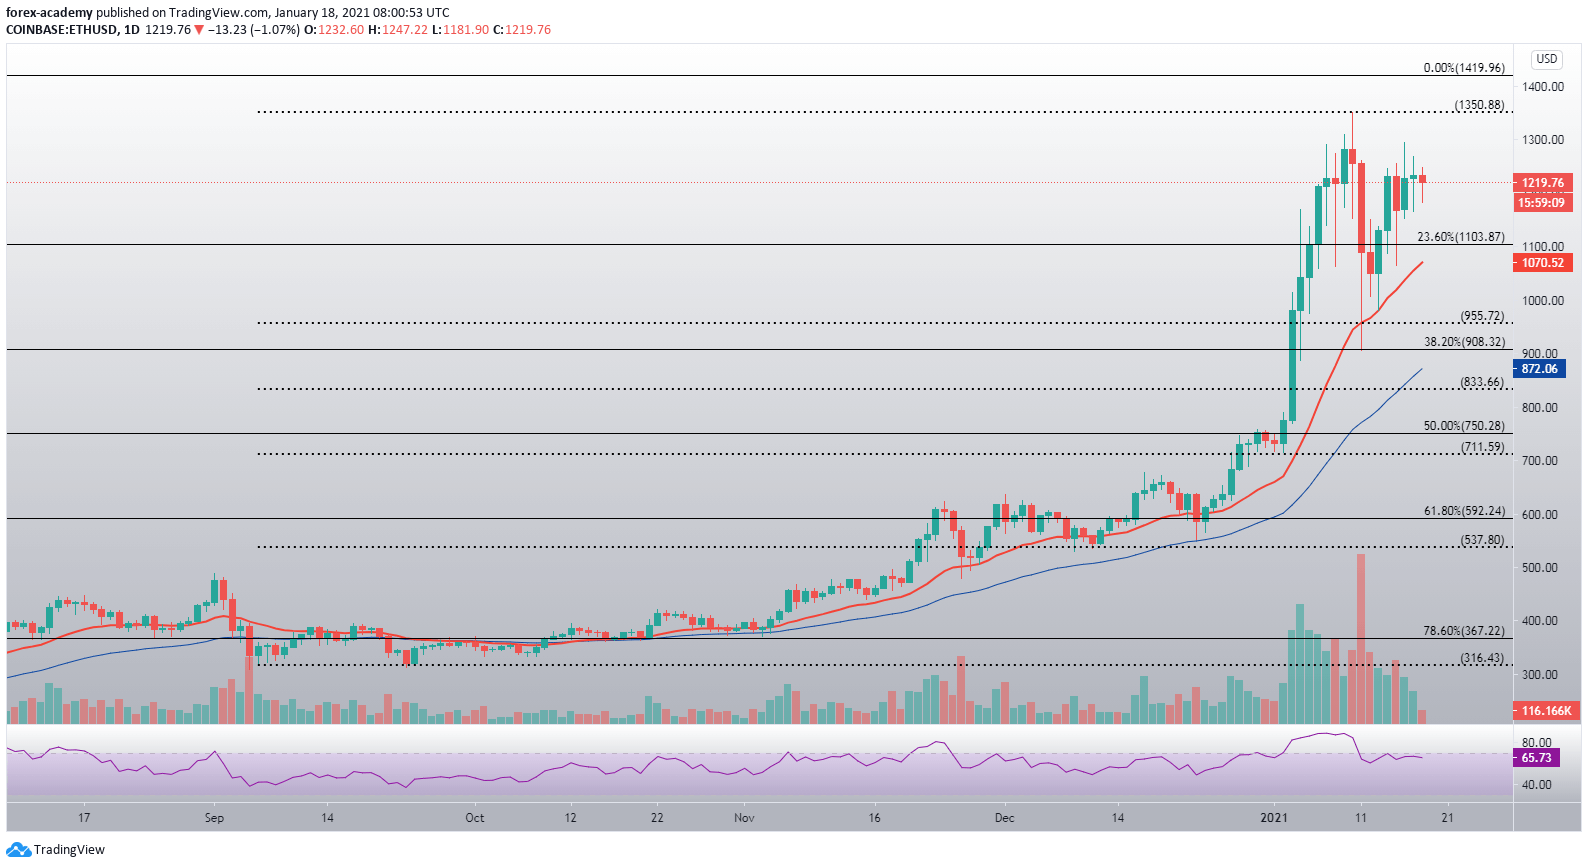
The technical overview shows Ether’s daily RSI chart stepping out of and hovering just below the overbought area, with its value currently sitting at 65.73.
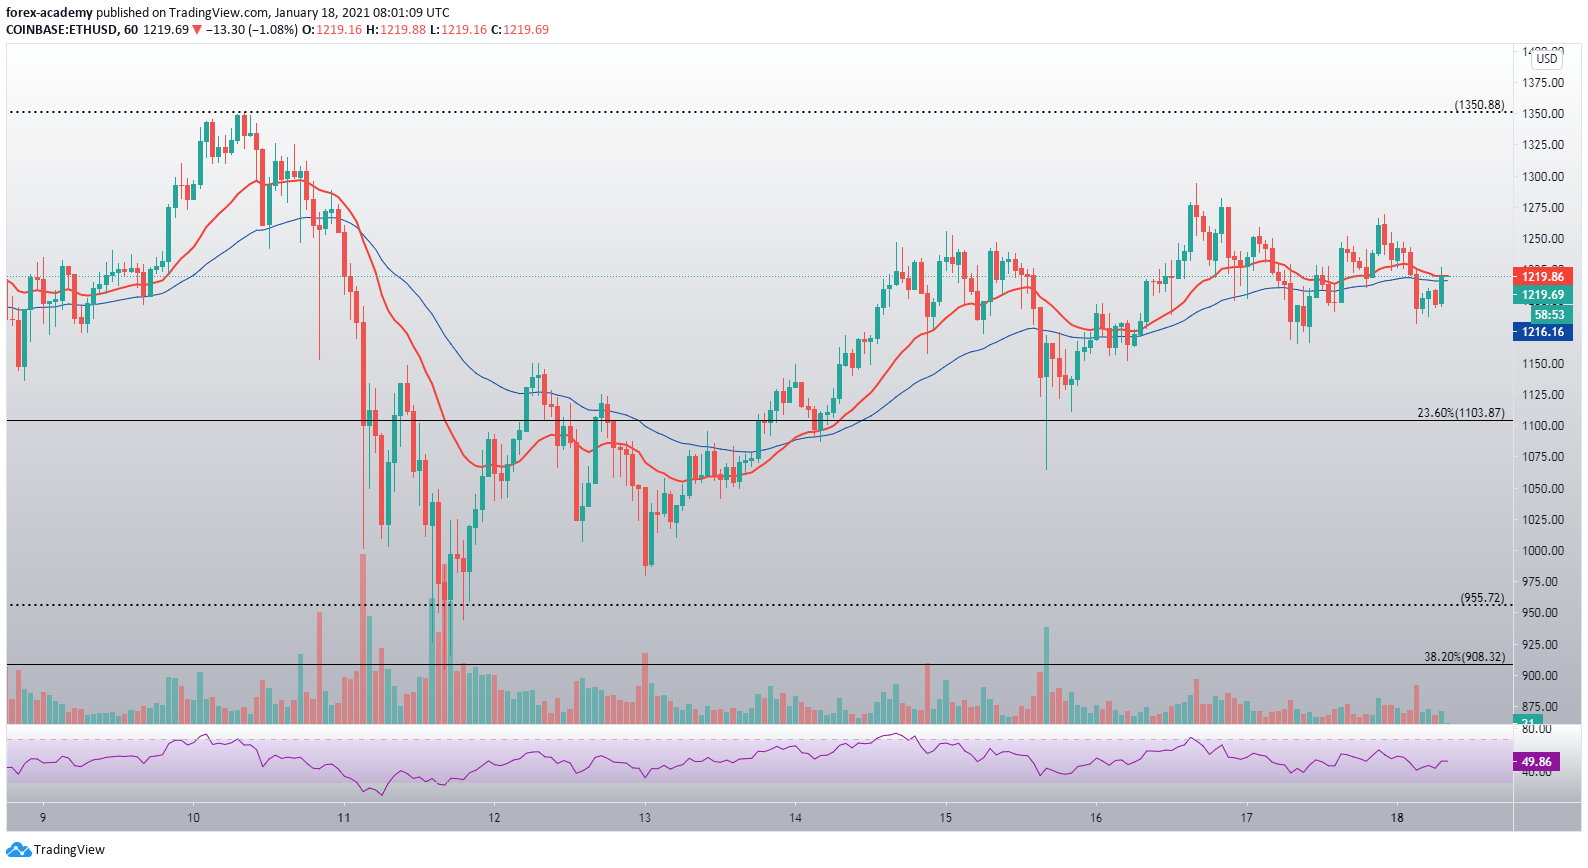
Looking at the hourly time-frame, we can see Ether’s price rise that started on 13 Janurary, and ended on 16 January. This move has increased Ether’s price by $300. Its inability to break the $1,300 level has triggered a slight volume decrease (which was already prominent on the daily chart) and a period of sideways movement. Traders are expecting Ethereum’s price to move very soon.