An upbeat sentiment across the market and a spike in new addresses could catalyse a new price pump for Litecoin
Litecoin, like most other altcoins, posted some great upside action over the weekend as LTC bulls mirrored Bitcoin’s and Ethereum’s stellar performances. As the BTC price broke to the $45,000 mark for the first time in over two months, Ethereum pumped on the back of a successful London hard fork to see ETH/USD break the $3,000 level.
Litecoin took the cue to break above $150, recording two consecutive daily closes above the level for the first time since 20 June.
As of writing, LTC is trading at around $149, slightly lower as profit taking appears to be limiting early morning deals this Monday.
But if bulls resume the uptrend, they could see a 26% upside to a key resistance level.
Litecoin price outlook
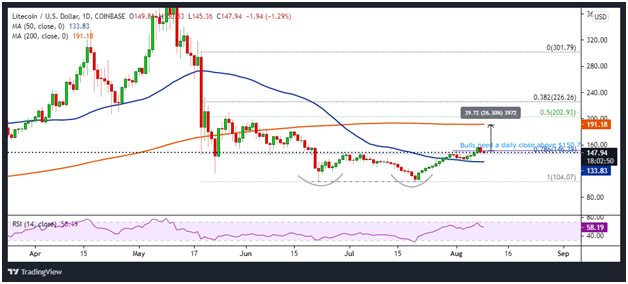
Litecoin price has traded above the 50 SMA line since a rebound off lows of $1.04 saw buyers breach resistance around $138. The bounce confirmed a double bottom pattern and consolidation above the 50 SMA gave bulls a chance to attack the resistance line at $147.
The price has turned lower since the rally to a 7-day high of $157, but a clear daily close at or above $150.79 would allow LTC bulls to target more gains towards the flatlining 200 SMA near $191.18.
A clear break of the barrier for the LTC/USD pair would see buyers make a 26% move from current price levels.
This is an outlook that will likely buoy bulls and attract fresh interest around $200, giving buyers the chance to push past $200 and even the 38.2% Fibonacci retracement level of the swing from $301.79 to $104.07 at $226.26. 
LTC/USD daily chart. Source: TradingView
On the downside, Litecoin price faces a potential dip below the 78.6% retracement level at $146.39. Buyers will remain in control if they hold this level and seek fresh ground. As seen on the chart above, the daily RSI above 50 supports the chances of an immediate bounce.
A downturn though will expose LTC to bearish conditions suggested by the sloping 50 SMA curve at $133.83, with losses likely to bring the support line of $104.07 into play.

