DOT/USD has surged 6% on the day, reaching an intraday high of $41.08 as bulls target $50
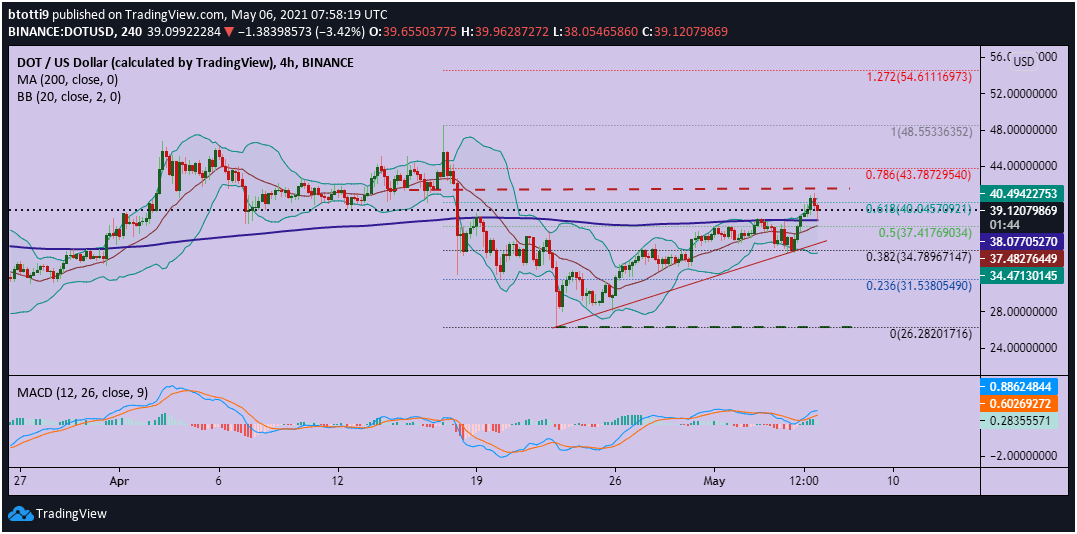
Polkadot has seen a steady rebound along a bullish trend line formed on the 4-hour chart to help price recover above $30.
The digital asset is trading around $39.12 as of writing, about 6% up on the day and 16% this past week. Today’s upside pushed it to highs of $41.08 before sellers set in looking to scupper the bulls’ plans.
If DOT bulls mirror recent gains for major altcoins like Ethereum, Litecoin, and XRP, its price might reach a new all-time high above $50.
The cryptocurrency has a market cap of $36 billion and ranks eighth in the crypto market behind Cardano (ADA), which sits at $48.6 billion.
Polkadot price analysis
DOT climbed to an all-time high of $48.36 on 17 April, before breaking into a downtrend as bears forced their way below the 200-day simple moving average. The price continued lower, breaking past the 50% Fibonacci retracement level of the move from $48.36 high to $26.38 low.
The technical picture shows that the MACD remains in the bullish zone, with the histogram trending green above the baseline. Prices are also fluctuating near the upper curve of the Bollinger Bands.
As long as buyers hold prices above the 200 SMA ($38.07), bullish momentum will likely push DOT/USD above the immediate resistance at the 61.8% Fib level ($40.05).
If bulls can manage to reach the next target at the 78.6% Fib ($43.78), an upward path to $48.36 and $54.61 will open up.

DOT/USD 4-hour chart. Source: TradingView
Conversely, bear presence above the 200 SMA could overpower bulls. In this case, the price might drop to the next support zone near the middle curve of the Bollinger Bands.
Here we have the 50% Fib level ($37.41), and below it the lower bands and the 38.2% Fib that offer a robust demand zone near $34.78. In the event sentiment in the broader market flips negative, DOT/USD could be vulnerable to short-term declines to $30 and then $26.00.

