ETH eyes $3k, BTC holds above $54k, and XLM is set for an upside above $0.55
Ethereum (ETH) reached a new all-time high of $2,800, leading the altcoin market as Bitcoin (BTC) continued to battle pressure near $54,000. Ethereum might attempt to reach $3,000 over the next few days, while BTC is likely to first seek support near $53k before embarking on a fresh upside in May.
Stellar (XLM) is trading near the $0.50 support level, which could be critical to bulls’ plans for another leg up after its price increased by over 25% this past week.
What, then, is the price outlook for ETH, BTC, and XLM as we head towards the monthly close?
Ethereum price

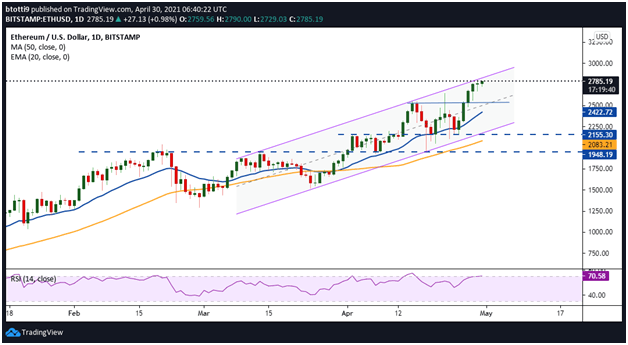
ETH/USD daily chart. Source: TradingView
Ethereum’s price is up 23% over the past week, trading higher on positive news that the European Investment Bank had launched a $120.8 million “digital bond” project on the Ethereum blockchain.
European Investment Bank is issuing 2 year digital bonds on Ethereum through Goldman, Santander, and Societe.
Wow. @GoldmanSachs #Ethereum @RaoulGMI pic.twitter.com/kaQIrZ9C9V
— Michael Tant 🐻⛓ (@MichaelTant3) April 27, 2021
Although the RSI suggests some exhaustion, the price remains near the tip of an ascending channel on the daily chart. The rising curves of the moving averages also suggest the potential for a new upside.
If the uncertainty suggested by the previous candlestick resolves on the upside, ETH/USD could rally to $3,000. The immediate target beyond this barrier would be $3,200.
The channel middle line near $2,550 and the 20-day EMA ($2,422) should act as primary support levels if price turns down.
Bitcoin price

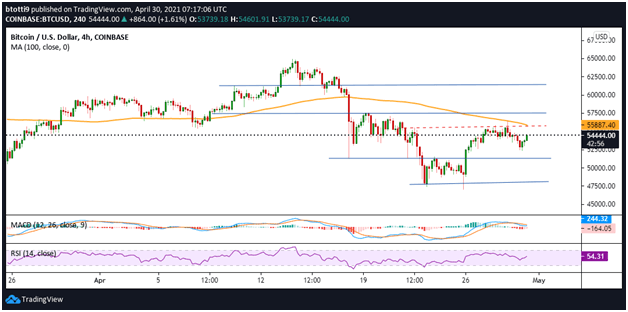
BTC/USD 4-hour chart. Source: TradingView
Over $4.2 billion options expire today, a factor that has seen some pressure on BTC as it hovers near $54,500.
Price is likely to flip higher short term if downward pressure decreases post the options expiry.
In this case, an upward shift in sentiment could ignite fresh momentum in the Bitcoin market. The RSI and MACD are positive and BTC/USD might extend towards the100 SMA on the 4-hour chart ($55,880). Further gains lie near the decline points of $57,800 and $59,560. Per one analyst, BTC/USD
Conversely, failure to consolidate above $54,000 might see Bitcoin price fall towards support at $53k and $51,200.
Stellar price

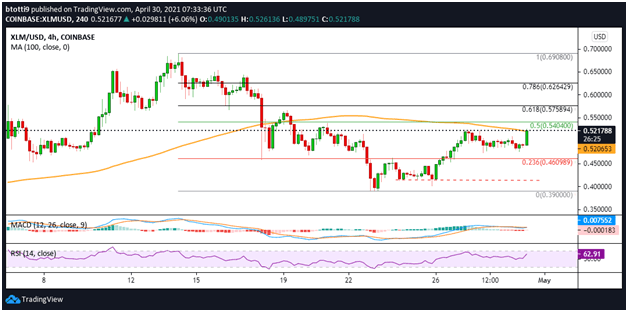
XLM/USD 4-hour chart. Source: TradingView
XLM bulls are looking to hold prices above a major horizontal support line at $0.50. The 100 SMA line ($0.52) on the 4-hour chart currently provides an immediate barrier. If they manage to break higher, a retest of the $0.54 level, where the 0.5 Fibonacci retracement level is, would allow for further gains towards the 0.618 Fib level ($0.57).
The next barrier would be at $0.62, with a push for $0.70 likely if upside momentum continues.
On the downside, a break below $0.50 will invite additional sell-off pressure and push XLM price towards support at the 0.236 Fib level ($0.46). Bears might then target a low of $0.39 if downside correction takes prices beyond the $0.41 support line.

