The crypto market seems to have eased up on the first day of the month, with bitcoin dropping below $9000.The same trend was reflected in the rest of the crypto market, as we can see in price moves of Tron, Cardano and EOS in yesterday’s intra-day trading. Let’s now go through some of these cryptos to determine, how they did in yesterday’s intra-day trading (Charts from Bittrex.com).
Tron (TRX)
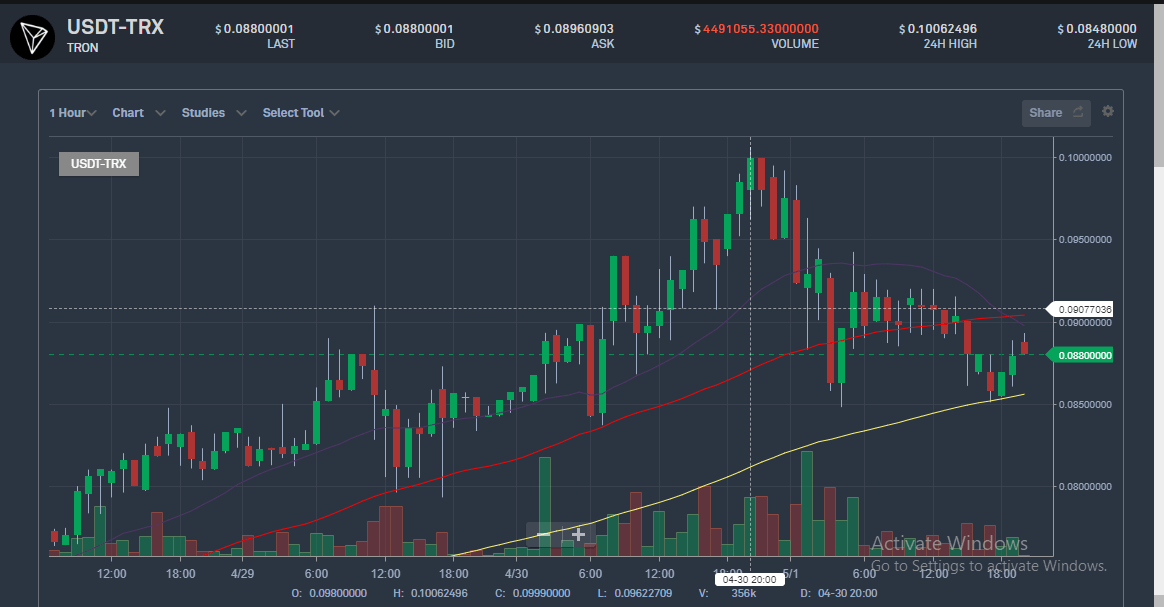
In the last few hours of Tuesday, Tron dropped slightly to sit on the 100-day moving average and seems to be back on the rise again. That’s an indicator that the upward momentum is still there. Volumes too are on the rise, indicating that Tron’s potential in the short term.

For someone looking to invest in Tron at the moment, this would be a great time to do so. That’s because with the support firmly established, the next major support will be at $0.09 which is the 100-day moving average. If it breaks above that, Tron’s next area of major resistance is at around $0.9999 price level.
This is pretty much in line with bitcoin’s price at the moment, which has also broken back above $9000. As it gains back up, so will Tron. Besides, Tron is also being pushed up by the upcoming main net launch which will happen in June.
Cardano (ADA)
Cardano is one of the best projects in the market at the moment. That’s in part because it is hailed as being based on sound the scientific philosophy. It already has a strong following from investors, traders and enthusiasts.
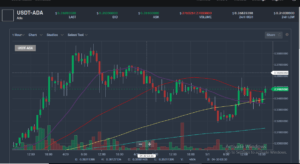
A few days ago they managed to solve the proof-of-stake, by making it secure and scalable at the same time. The same is reflected in Cardano’s intra-day trading charts. In the last few hours of Tuesday, Cardano was trading in positive territory and moving along the 21-day moving average.

This is way above the first point of support, which is the 100-day moving average at $0.33. Volumes too are on the rise indicating that there is strong demand for Cardano at the moment.
Another indicator of the growing momentum of Cardano is the candlestick patterns. In the hourly charts, we see two full green candles, which usually signifies strong bullish momentum.
For anyone looking to buy into Cardano in intra-day, making an entry at current prices would still give a great return. That’s because if the current momentum continues, the next point of major resistance is at $0.38.
Ripple (XRP)
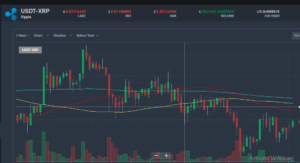
Ripple has been a little slow to catch up with the rest of the crypto market. This weakness is also reflecting in intra-day trading (May 1). In the hourly charts, the moving average is aligned in a bearish pattern, with the 200, 100 and 50-day moving averages acting as resistance points.

Ripple also seems to be forming lower lows, meaning that Ripple could be getting into a short-term bear run.
Anyone looking to buy into Ripple right now would be better off waiting it out. There is an indication that it could drop to around the $0.79 price level. That would be a better low-risk entry point.
Disclaimer: This content is for information purposes only and is not intended as financial advice or any other advice. It is not an offer or solicitation to buy or sell nor is it meant as an endorsement or recommendation for any security. The information is general in nature and does not take into account your individual financial position. You should seek advice from a registered professional investment adviser and undertake due diligence before making investment decisions.

