Ripple (XRP) saw a major decrease in network activity following the Flare airdrop, causing its price to dip below $0.5
The fourth-largest cryptocurrency by market cap had another bad day as it continued following the descending channel created on 1 December. XRP kept creating lower lows, ultimately passing $0.5 and $0.4695 to the downside, making it very hard for XRP bulls.
There is no doubt that the overall outlook on XRP is currently bearish, due to both the fundamental and technical indicators. XRP’s network activity has dropped significantly after the Flare (FLR) airdrop. When taking a look at its week-over-week performance, XRP has posted a 16.75% loss, making it the most prominent weekly loser out of the top 10 cryptocurrencies. On the other hand, BTC and ETH posted week-over-week gains, increasing their prices by 7.50% and 7.39%, respectively.
At the time of writing, XRP is trading for $0.456 — and is 27.69 % in the red compared to last month.
Technical analysis XRP
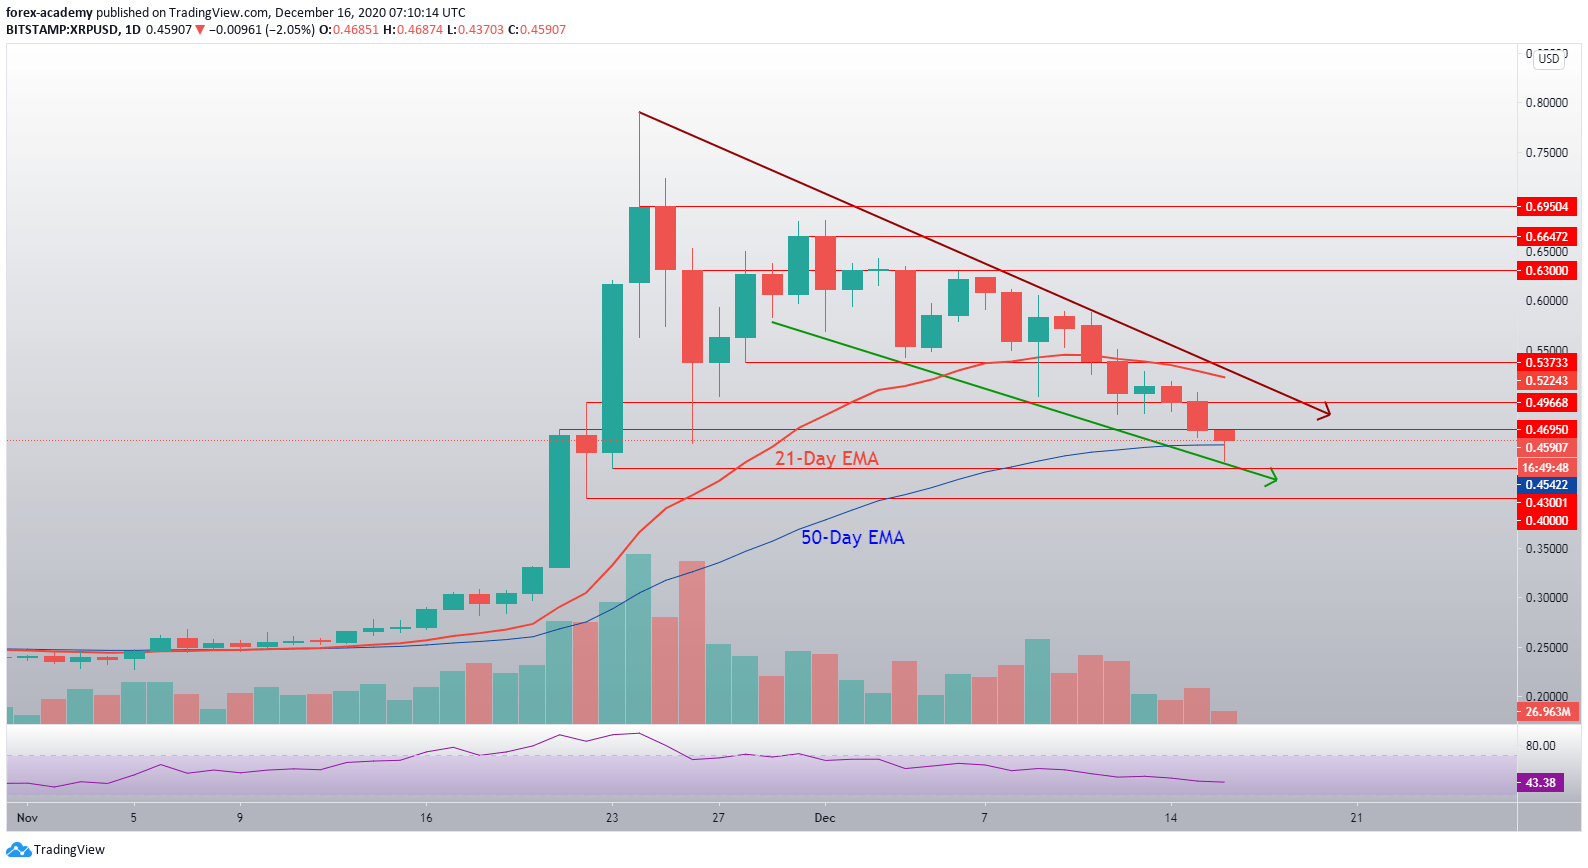
XRP has been trading within a descending channel ever since 1 December, but was a part of a larger descent that started ever since price hit the $0.79 wall. While the overall sentiment is very bearish, there are some hints of a price reversal.
XRP’s price is currently held from descending in a steeper fashion by the green descending support level and the 50-day EMA. Some analysts are also calling this the fourth of five waves in a technical formation that began on August 20, which projected XRP’s price at over $1 when the fifth wave comes into play.
 XRP/USD daily price chart. Source: TradingView
The technical overview shows that XRP’s RSI indicator continues its descent from late November levels on the daily chart as it currently sits just above the 43 mark. The volume seems to have been steadily decreasing since late November as well.
XRP’s current bearish sentiment is stopped in the short term by the green descending support level and the 50-day EMA. If XRP breaks any of these levels to the downside, we can expect the $0.43 level to be the first zone of support. If, however, XRP tries to make a price reversal, it would need to break the dark-red descending resistance line with confidence.
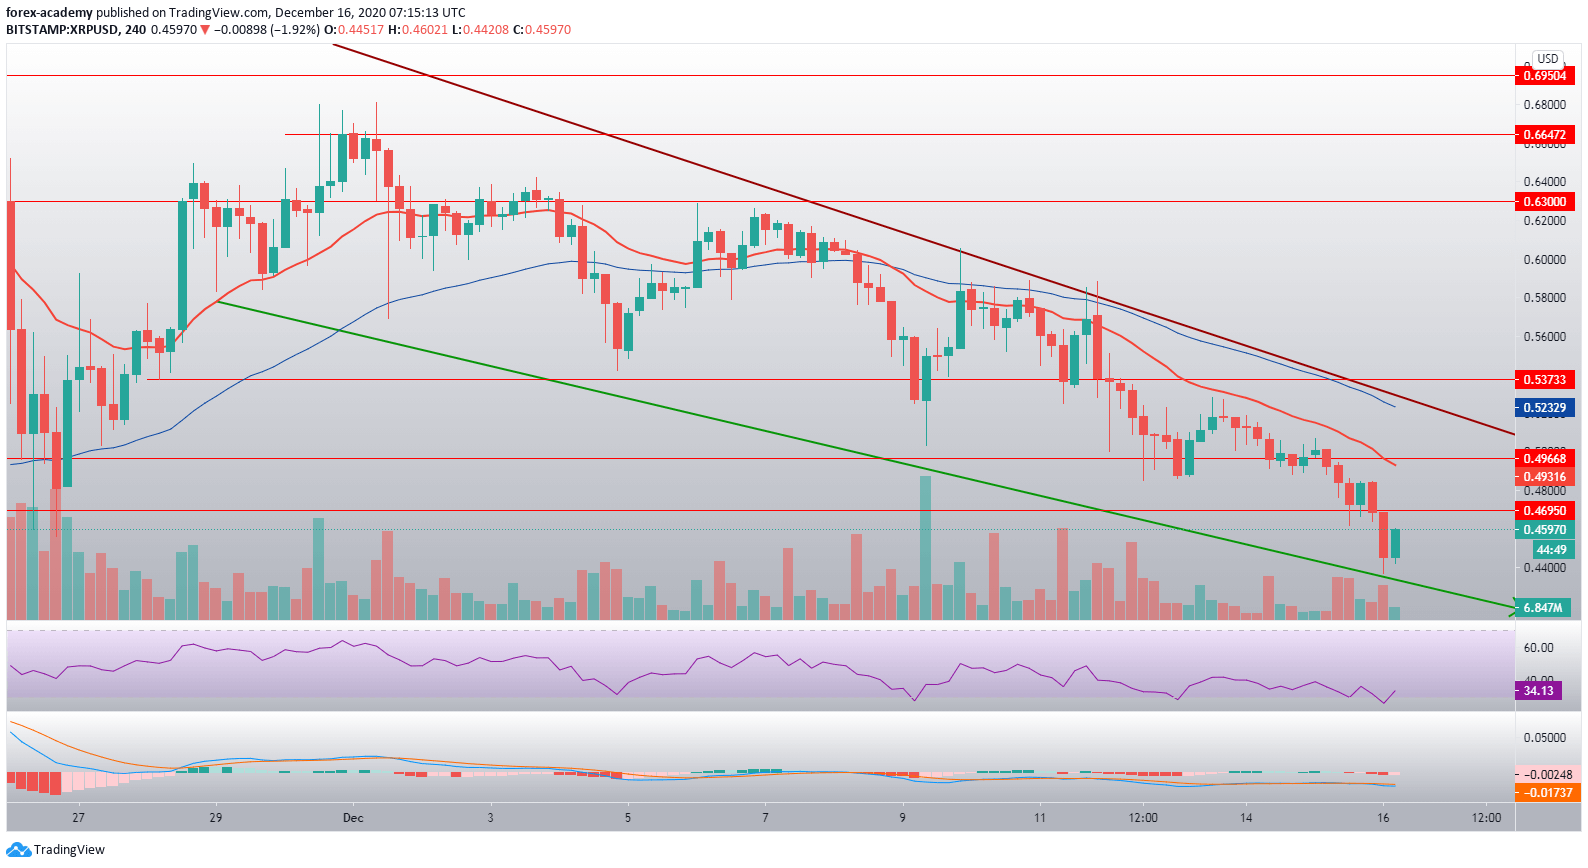
 XRP/USD 4-hour chart. Source: TradingView
When taking a look at the 4-hour time-frame, we can clearly see the downtrend that XRP is currently in. XRP’s 4-hour RSI stepped into the oversold territory for a moment, but exited it right after as the price hit a buy-wall at the green support line.

