Bitcoin slumped to lows of $8,980 on Wednesday, the decline dragging the rest of the market lower
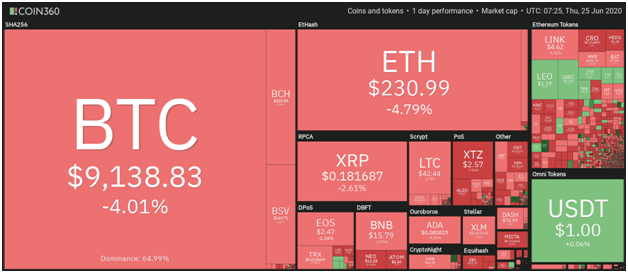
The cryptocurrency market fell into a sell-off to mirror the stock market slump as recovery hopes faded on news of an upsurge in coronavirus cases in the US. As of writing, the majority of the cryptocurrency market is in red, with prices likely to dip further if buyers fall away to more selling pressure.

ETH/USD price
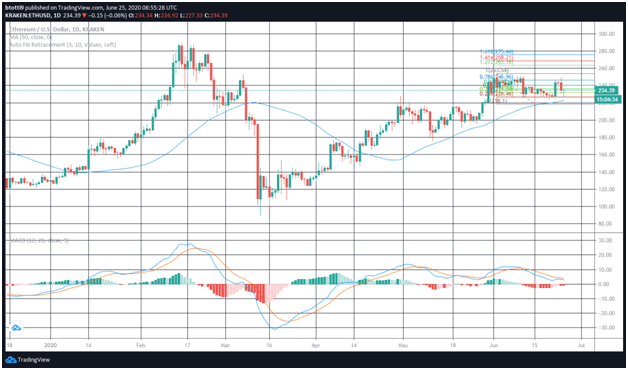
ETH/USD has dropped from highs of $249 to lows of $230 on the day, with the second-largest cryptocurrency seeing its value reduced by 4.79%.
As of press time, Ether bulls are looking for a rebound to higher levels. If the ETH/USD recovers above immediate resistance at $233, a short term uptrend might face seller rejection at $240.
On the 4-hour chart, Ethereum’s price is trading below the moving averages. If prices stay below the 50 SMA and 100 SMA, and the former continues to cross under, increased selling pressure will likely push ETH/USD prices lower.
Bulls need to clear $233 and $235 to establish an upper hand. An upside is forming given the RSI is turning positive, though it remains in oversold territory at 44.6 on the 4-hour timeframe. The MACD is also in the negative zone but is moving towards the midline.

XRP/USD price
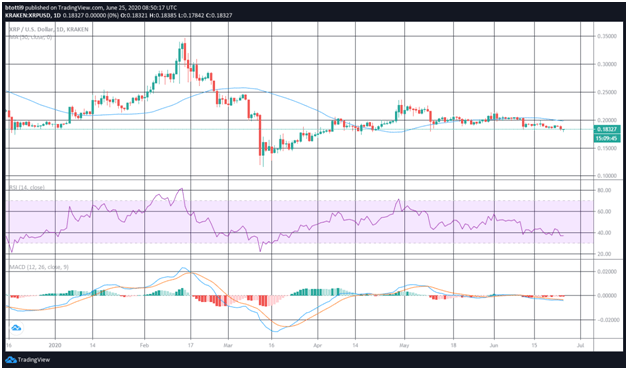
Ripple’s price broke below $0.1800 on the day to $0.1797, before a slight upside pushed it back to $0.1833. The XRP/USD pair has traded at a high of $0.1890, but with bears hovering, prices below intraday lows cannot be discounted.
The XRP/USD pair broke the lower limit of its descending triangle, so buyers must now recover above it to avoid a slip to support levels at the .5 Fibo of $0.175. Failure at this level opens up the possibility of $0.16. The pair currently exchanges hands at $0.1835, which is currently near the bottom of the triangle.
For the bulls, resistance is expected at the 50 SMA and 100 SMA (on the daily charts) at $0.1924 and $0.1983 respectively and at $0.20 (100-day EMA).

Wall Street slips on bleak IMF forecast
The S&P 500 has declined by 2.59%, a suggestion that renewed restrictions in New York and other US states — alongside a bleak recession forecast by the International Monetary Fund (IMF) — could see stocks slide further.
The crypto market’s recent increased correlation with stocks might mean similar slumps in the short term. In the crypto market, yesterday’s Bitcoin sell-off was replicated among most of the top altcoins. Ethereum, Ripple and Bitcoin Cash have also experienced significant price drops.
In April, the IMF projected the global economy would shrink by 3%. However, its latest forecast revises the shrink to 4.9% — dampening market outlook as many hoped for a quicker turnaround from the coronavirus-induced global recession.

