Stellar (XLM) and IOTA (MIOTA) recently reached new highs as Bitcoin rallied to prices above $64k
Bitcoin rallied to an all-time high of $64,863 this week, as did Ether, which notched a new peak of $2,547.
Elsewhere, Binance Coin (BNB) reached $637, Ripple’s XRP shot to prices near $2.00, and Dogecoin (DOGE) roared to $0.298 after yet another Elon Musk tweet about the meme coin.
Here is the market outlook for Bitcoin, IOTA, and Stellar.
BTC/USD
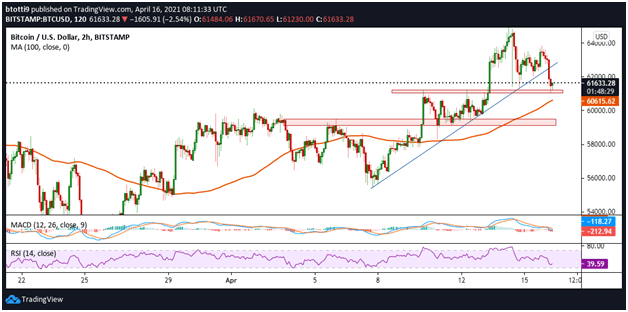
BTC/USD is likely set for further downside action after breaking below an ascending trend line on the 2-hour chart. Currently, bears are looking to revisit the support zone at $61,100. Bulls need to hold prices above this level to retain the upside advantage.

As the chart shows, the technical picture slightly favours sellers as the MACD and RSI both signal negative action.
If BTC/USD breaks below the $61k support level, the next anchor is likely at the 100 SMA zone near $60,614. A bearish continuation to the $60k line looks certain before a fresh bounce happens.
A clear break above $62.5k could help bulls bounce to the next resistance at $64,800, with a potential spike towards the $68,000-$70,000 range.
IOTA/USD
IOTA is ready for its Chrysalis update, which will go live starting 21 April 2021. The cryptocurrency is seeing an uptick in sentiment, which might help the MIOTA price in the short term.
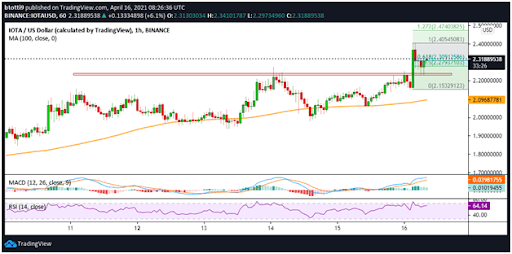
IOTA/USD currently trades above the 61.8% Fibonacci retracement level of the move from $2.15 to $2.40. Buyers are looking to strengthen the upside after rebounding off support at $2.20, which is likely given the technical perspective suggested by the hourly RSI, which sits over 60. The MACD also remains within the bullish zone to point to a possible flip towards $2.40 and then $2.47.
If the price turns lower, immediate support lies at $2.20, with further cushions at $2.15 and the 100 SMA at $2.09.

XLM/USD
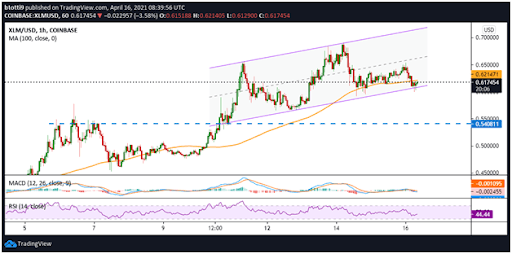
XLM/USD remains within an ascending parallel channel since the breakout above $0.55. The failure to break resistance at $0.69 resulted in a sharp decline to $0.59, with prices largely range-bound around $0.59-$0.65.
The hourly chart suggests a short-term bearish outlook, with the MACD below the signal line after a bearish crossover. The RSI also retains a negative divergence below 50, while the negative outlook will strengthen if prices fail to break above the 100 SMA.

If upward pressure forces the bears to cede control, buyers can target the channel’s middle line ($0.66) and then $0.70.
On the contrary, a breakdown below the channel support could send XLM towards $0.54 and the robust buy zone at $0.50.

