The ZIL/USD and ZIL/BTC pairs are both precariously placed within long term resistance zones
As altcoins see red, Zilliqa’s (ZIL) has dropped 20% in the past 24 hours to be among the biggest losers in the top 100 list of largest cryptocurrencies by market cap.
The double-digit losses for ZIL/USD mirror the broader crypto market. Bitcoin (BTC) is down nearly 11% to trade at lows of $17,000 after coming close to hitting its all-time high.
Elsewhere, top altcoins like Ethereum (ETH), Ripple (XRP), Stellar (XLM) and Cardano (ADA) are all bleeding, even as bears take joy in the latest sell-off.
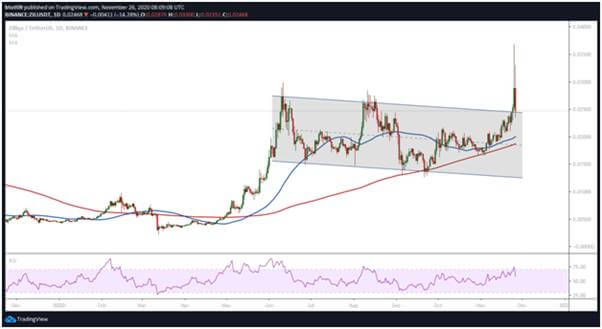
While a rebound in sentiment could see ZIL/USD attempt a break to $0.045, the short term picture as shown on the daily and 4-hour charts suggests an increase in downward pressure. The headwinds could thus see it dump to lows of $0.018 short term.
At the time of writing, the spot price for the token is around $0.023, about 12% lower in the past hour alone.
ZIL/USD
The Zilliqa price rallied nearly 45% in 24 hours as bulls cracked resistance at the upper boundary of the descending parallel channel.
The height of the channel’s base to the highest part of the boundary suggested bulls were in line for a breakout to $0.045.
But as the daily chart shows, bears quickly struck back. A flip in the Relative Strength Index (RSI) also means bulls risk losing the grip formed over the past several days.
The next target for bears could be to drive prices to the middle line of the parallel channel. If the downward pressure holds, expect ZIL/USD to retest the area around $0.020.
Further down, the 50-SMA ($0.019) and the 200-SMA ($0.018) provide support just above the descending channel’s middle line.
 ZIL/USDT daily chart. Source: TradingView
ZIL/BTC
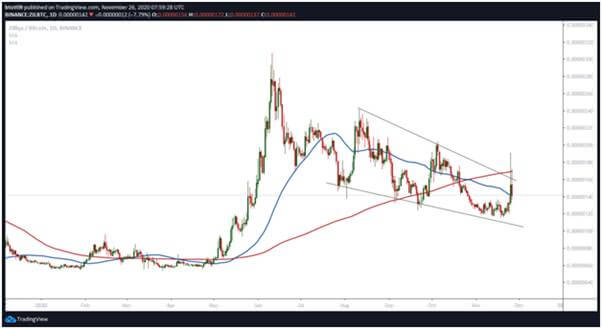
The downturn for ZIL/USD also coincides with a dip for the ZIL/BTC pair after a similar breakout.
Yesterday, the price of Zilliqa against Bitcoin looked to have broken out of a descending wedge pattern as bulls pushed from lows of 120 to 186 satoshis.
 ZIL/BTC daily chart. Source: TradingView
However, as shown in the daily chart above, ZIL/BTC is back within the confines of the wedge pattern at around 142 sats per unit. The negative action has seen Zilliqa against BTC drop below the 200-SMA. Additionally, the down-sloping 50-SMA suggests bears could yet push the pair lower.
If ZIL/BTC continues to tank, the next support line could be the lower trendline of the declining triangle pattern near the 100 satoshi line. For a more detailed forecast, check out our Zilliqa (ZIL) price predictions.

