The monthly candle close is one of the most useful tools for mid-term and long-term technical analyses. As March has become one of the most volatile and deterring months in the history of global markets, some traders are looking forward to facing the crash with proper strategies while others are already taking advantage of the situation. This article aims to spot the key prices for Bitcoin, Ethereum and Ripple as they face one of the most volatile yet auspicious arenas for high-risk traders due to the COVID-19 pandemic.
BTC/USD: Has the Coronavirus Dramatically Changed the Overview?
Bitcoin opened 2020 with a bullish technical bias confirmed by multiple signals such as the occurrence of a golden cross in the moving averages and a +50% rally. But panic seized Bitcoin as well, as virtually every single financial instrument after the COVID-19 pandemic came to the forefront.
However, after a dramatic fall to 3,900 USD, the price of Bitcoin showed a remarkable recovery of more than 65%, closing March at 6,438.64 USD, according to the average numbers reported by CoinMarketCap.
Let’s have a look at the daily chart insights:

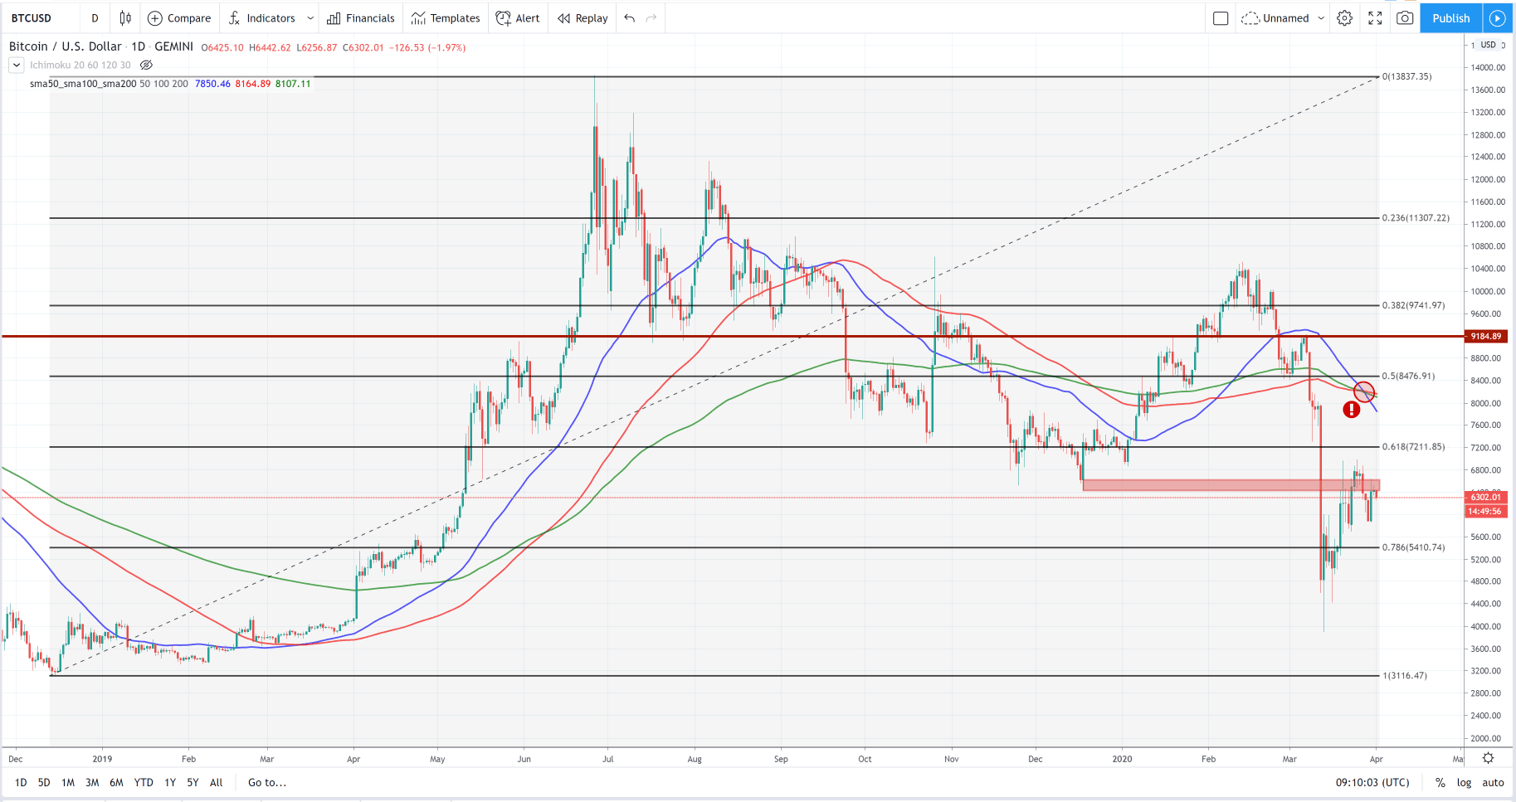
- The unexpected turn of events has rapidly invalidated the golden cross created by the simple mean averages (SMA50 & SMA200) on February 20th.
- Prospects might have changed dramatically despite the recent rally as a death cross has emerged last Friday. A death cross is a bearish indicator that has proven to be reliable in most cases for mid-term biases.
- The Fibonacci retracements give some ideas of the S/R levels for Bitcoin in broad strokes. For intermediate levels, traders will need to take a closer look at smaller time-frames.
- BTC is currently trading at a resistance range between $6,400~$6,600. A bullish momentum might take Nakamoto’s invention to the next FIB resistance around $7,200.
- The upward path faces volatility with a clear S/R level close to 8,475 USD, a clear resistance around $9.2K (not denoted by Fibonacci) and a high volatility index expected at the $10K psychological resistance.
- On a bearish note, BTC might revisit the unstable USD 5,500 vicinity in search of support. If the bulls are unable to defend those prices, BTC might retest its year-to-date lows around $3,9K before plummeting to the lower range of three thousand dollars.
- With impetuous price actions and volatility around the corner due to the coronavirus crisis, those technical prospects are subject to change and we suggest a continuous follow-up.
- Another crucial event is coming in only 42 days (according to Bitcoinblockhalf) as the miners will see their “block rewards” reduced from 12.5 BTC to 6.25 BTC. This upgrade to Bitcoin’s network is scheduled to occur every 210,000 blocks—approximately 4 years —and is known as “halving”. In the past, halvings have pushed Bitcoin upwards. With a deflationary model, Bitcoin caps its supply to a maximum of 21 million BTC and reduces issuance over time to drive demand and avoid issuance of inorganic money.
ETH/USD: The 3-Figure Struggle
The second-largest crypto coin by market capitalization plummeted after the coronavirus FUD (check our crypto-glossary), falling below the $100 mark for a short time. The decentralised development leader keeps aiming for its long-awaited all-time-highs with strong fundamentals, but it has struggled to convince the bulls across the ‘gloom and doom’ economic scenario.
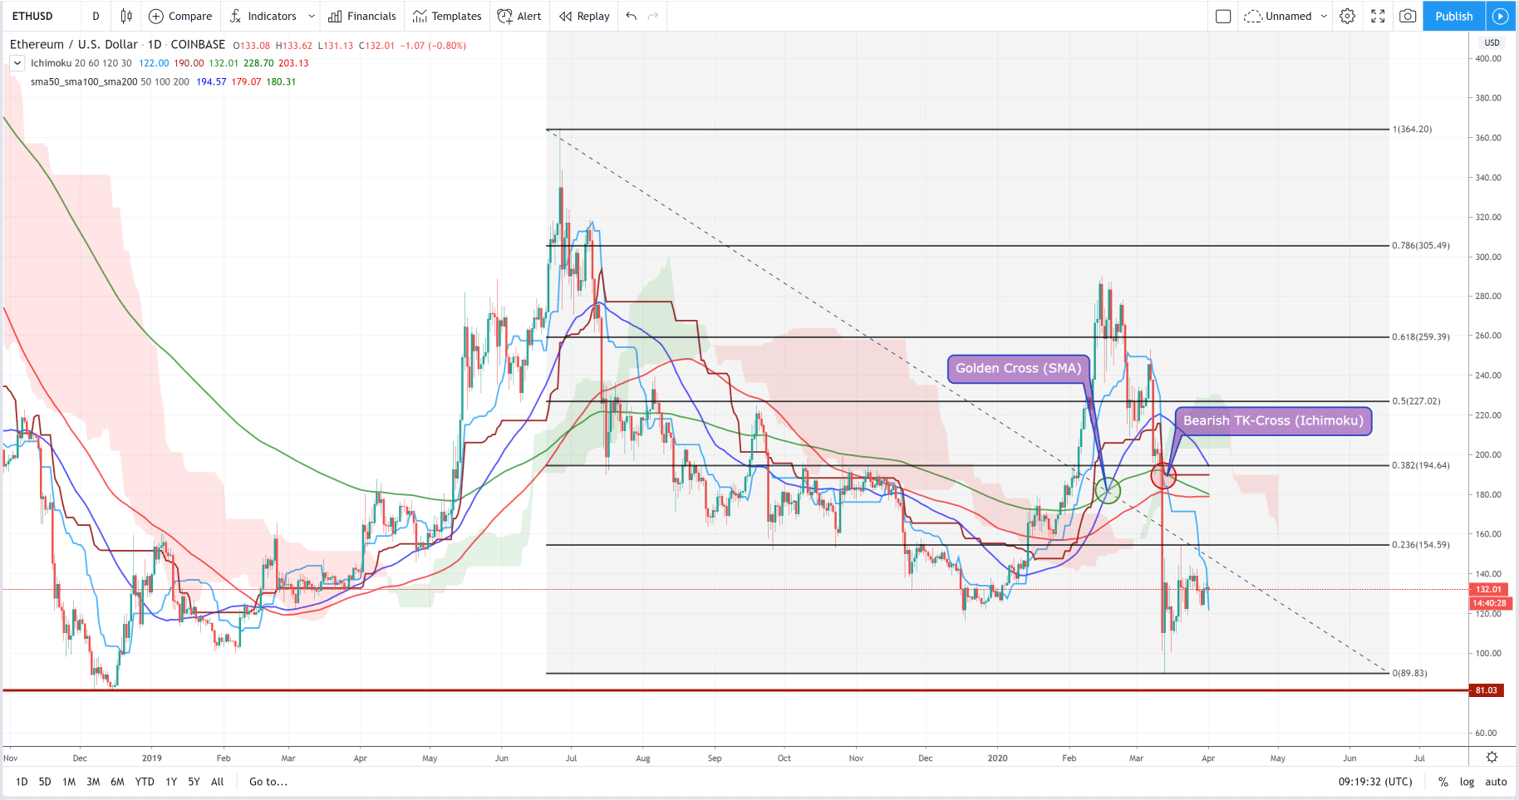
Unlike Bitcoin, the price of ether has managed to hold the bullish golden cross up, but is the daily chart outlining a bearish flag?

- ETH is currently trading at the accumulation zone around $120~$135, but is forming a bearish flag on the daily chart.
- If confirmed, this signal might take the ether back to year lows around USD 90. If this support is unable to sustain, ETH would retest 27-month lows of $81 in a not unlikely worst-case-scenario.
- Once again, Fibonacci retracements outline the main S/R levels to watch for Ethereum amidst the COVID-19 volatility. The most crucial resistance in a short-term is clearly placed at the $154.5 mark.
- If Ethereum succeeds to crush this level, the digital currency could be boosted to the next resistance level around $190. The next midterm levels to watch are clearly outlined by the following FIB retracements: $227, $259 and $305.
- It’s worth mentioning again that short-term levels are better off determined via a smaller time frame analysis.
- While the golden cross is still valid, the Ichimoku Cloud indicator shows a bearish TK-Cross with the Tenkan-Sen crossing the Kijun-Sen line downwards. However, the cross occurred above the Kumo Cloud, which signals a weak bearish bias—typically temporary—.
- That being said, ETH is one to keep an eye on as it’s still developing a confirmed bias. The possible launch of ETH 2.0 this year might also bring the bulls back as this upgrade is probably changing the whole game for Ethereum in the future.
XRP/USD: The bearish dead-end
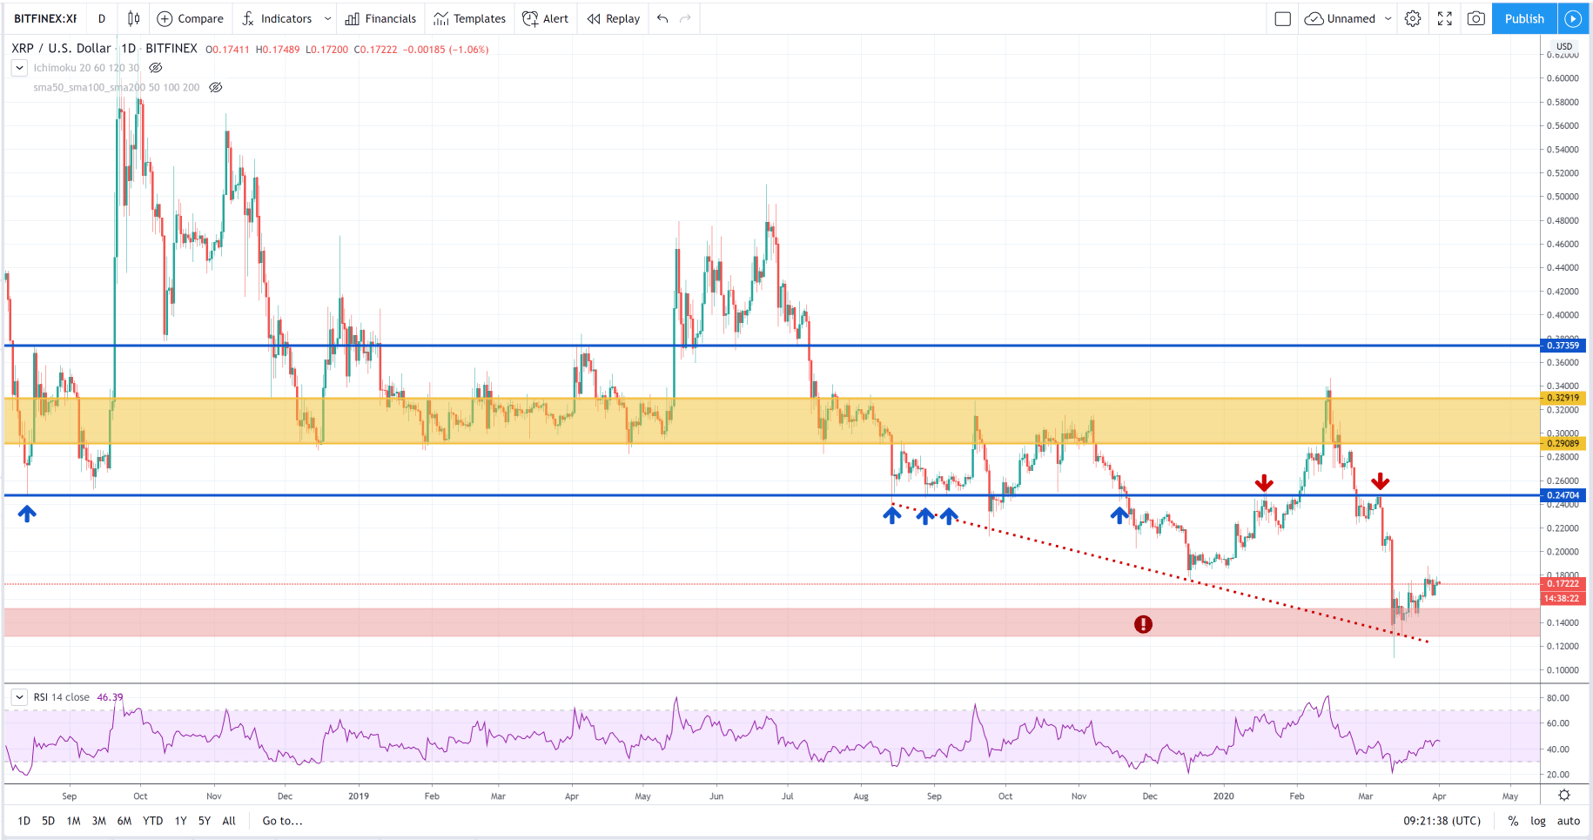
While both Bitcoin and Ethereum have shown bullish technical indicators in the past few months, seems like Ripple’s are nowhere to be found. The XRP has drawn a clear bearish trendline of lower lows since August 2019, failing to break through key resistances during the Q1 2020 rally.
Nonetheless, it’s been affected to a lesser extent by the coronavirus outbreak. While some of its counterparts have recorded historic drops, the XRP is only 18 % down from its initial price on March 12th, the date where the global markets collapsed. Let’s take a look at the daily chart:

- The levels are not fairly accurate and volatility makes it harder to use tools like Fibonacci retracements, so traditional charting techniques are used.
- Clear support around $0.247 has now become the first critical resistance in sight after the recent breakdown.
- If the bullish liquidity is big enough to break through this resistance, the XRP might revisit an accumulation zone between $0.29~$0.33, where it tends to stay for long periods of time.
- The trading battlefield becomes more unstable above the accumulation zone, with relative resistance close to $0.37 and the clear psychological level of 50 cents.
- If the bears win the battle, Ripple might fall to the “danger zone” once again, retesting support around $0.13.
- With the relative strength index (RSI) right in the neutral zone, there are no overbought or oversold conditions on the horizon, so both bulls and bears will have to come to a decision soon.

