XMR, MIOTA and XRP price outlook as the market heads towards the weekend with Bitcoin's price poised around the $48k level
Here is a brief technical look at Monero, XRP, and IOTA prices going into the weekend, with the broader outlook for Bitcoin (BTC) likely to impact these altcoins.
Monero price outlook
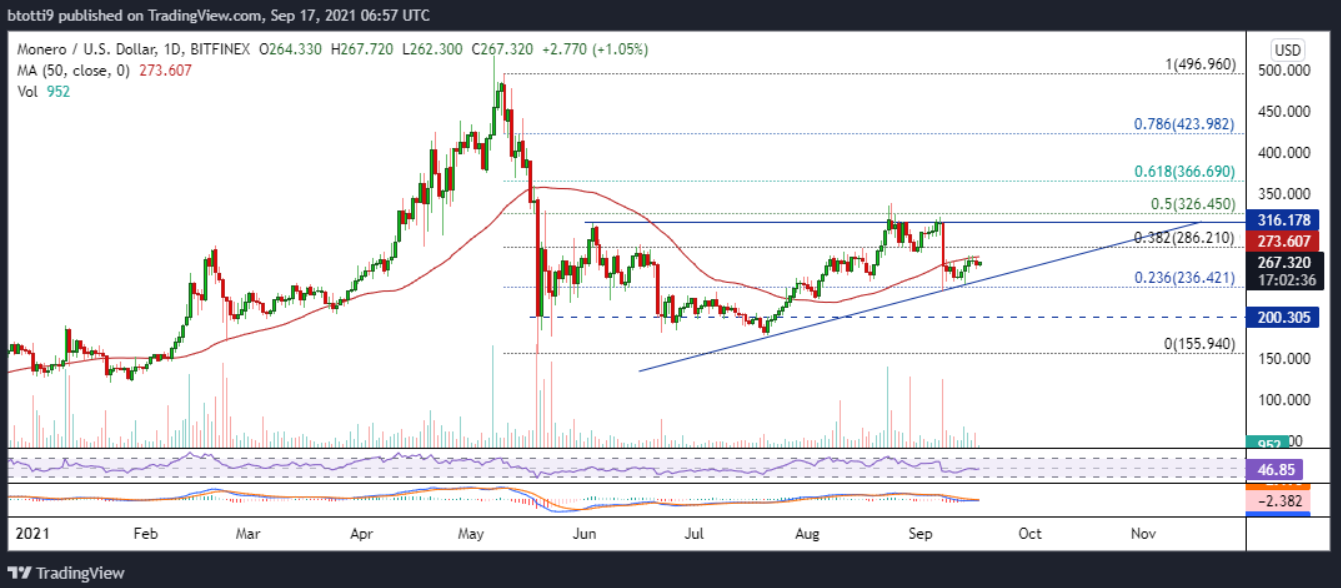
XMR is trading above the rising trendline of an ascending triangle pattern with the resistance of the horizontal line around $316. The RSI and MACD on the daily chart show sellers have the upper hand, although a divergence above the equilibrium line and potential bullish crossover respectively suggest new upside momentum.
While the overall technical picture is of a potential bullish breakout from the triangle, the XMR/USD pair needs to breach the supply wall at the 50 SMA to see further growth. The 0.382 Fib level ($286) and the 0.5 Fib level ($326) provide the next hurdles towards $400.
XMR/USD daily chart. Source: TradingView
On the downside, a breakdown below the triangle will likely see bulls seek to defend gains near $236, a zone marked by the 0.236 Fib level of the swing low from $497 to $156. Additional support could be near the 19 May pivot around $200.
XRP price outlook
XRP network activity has soared in the past few days, with technical analyst Ali Martinez highlighting this as a potential catalyst for a price increase.
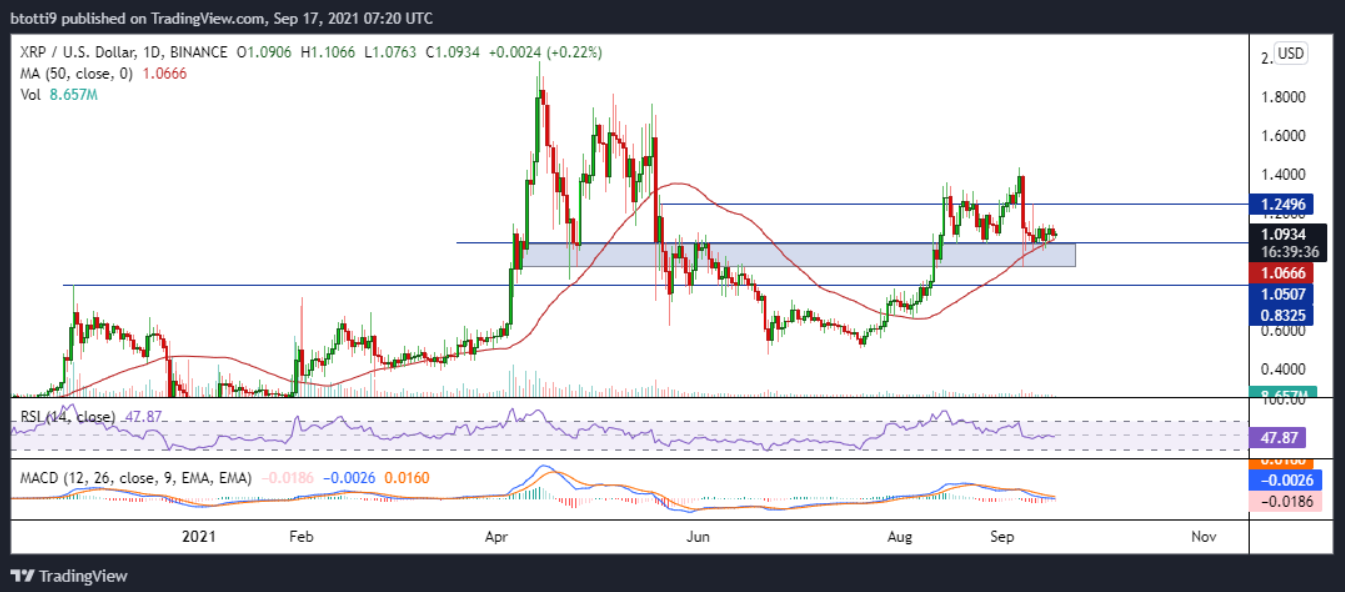
XRP/USD daily chart. Source:TradingView
The XRP/USD pair is above the 50 SMA to suggest slight strength above the horizontal support area around $1.05. However, a bearish flag formation threatens to see XRP price flipping below the primary demand zone (area highlighted in grey) towards $1 and potentially $0.83
The daily MACD and RSI support this perspective, though an upside flip could see XRP/USD eye $1.25 and then $1.40.
Check out our how to buy XRP page here
IOTA price outlook
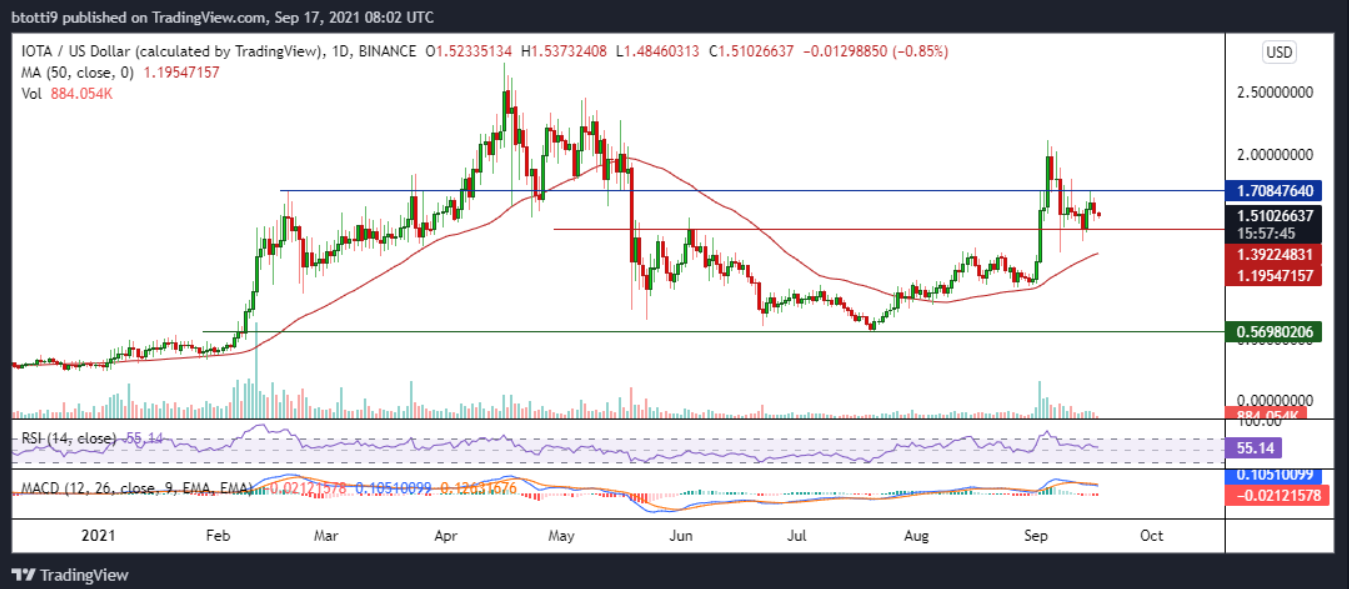
MIOTA is trading above $1.51, establishing local support around $1.39 after its bounce from lows of $1.35. Prices are above the 50 SMA, with the upside curve signaling further gains towards $1.70 and then $2 are likely.
IOTA/USD daily chart. Source: TradingView
However, while the RSI is above 50, it is sloping to suggest mounting pressure. The bearish crossover of the MACD also indicates a possible retest of the local support. Below this, MIOTA/USD could seek demand reload around the 50 SMA ($1.20).

